Download
1 / 44
440 likes | 475 Vues
This presentation outlines Thailand's energy landscape, policies, and strategies for promoting renewable energy and energy efficiency. It covers the mission of the Department of Alternative Energy Development and Efficiency (DEDE) and its organizational structure, as well as energy demand profiles, strategies for economic development, and renewable energy development targets and incentives. The text delves into specific programs like the biodiesel and gasohol projects, highlighting the shift towards renewable energy sources and the country's commitment to sustainable energy practices.

E N D
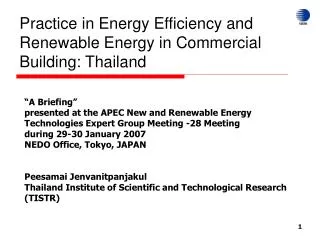
Renewable Energy and Energy Conservation Policy in Thailand Department of Alternative Energy Development and Efficiency (DEDE) Ministry of Energy (MOEN) October 2005
Presentation Outlines • Introduction to DEDE • Energy Situation in Thailand • Thailand Energy Policy and Strategies • Highlighted Programs • Promotion on Renewable Energy • Tax incentive • Energy Efficiency in Residential
Department of Alternative Energy Development and Efficiency( DEDE ) • Established in 1953 as a National Energy Office • Transfer to Department of Energy Development and Promotion (DEDP) under the Ministry of Science Technology and Environment in 1992 • Transform to DEDE Under the Ministry of Energy due to a Major Thai Government Reform in 2002
Mission “Encouraging the Promoting Energy Efficiency and Conservation as well as Providing and Developing Sources of Alternative Energy to Serve all Energy Consuming Sectors with Competitive Cost and Good Quality of Life ”
OrganizationStructure DEDE DEDE Secretariat Bureau of Energy Regulation and Conservation Bureau of Energy Research Planning Division Bureau of Energy Efficiency Promotion Bureau of Energy Development Bureau of Solar Energy Training Division Bureau of Energy Technology Transfer
Energy Demand Profile 2004 Thailand consumes energy about 1.45 million barrel of oil equivalent per day , 15% of GDP Agriculture 6% Hydro Coal Transportation 37% Industrial 36% Oil Natural Gas Res & Com 21% Primary Energy consumption Consumption by Sector* *2003 Figures
Thailand Energy Strategies for Economic Development and Regional Integration • Strategy for Efficient Use of Energy Reduce Energy Elasticity from 1.4:1 to 1:1 by 2007 • Strategy for Renewable Energy Development Increase share of RE from 0.5% to 8% of total final energy by 2011 • Strategy for Energy Security Ensure sufficient and reliable energy supply for at least 30 yrs • Strategy for Thailand as a Regional Energy Center Develop Strategic Energy Land Bridge and Energy Hub Cabinet Resolution on September 2, 2003
Strategy for Renewable Energy Development Commercial Energy TE = Traditional Energy NRE = New & Renewable Energy (265 ktoe) 2003 TE 11% 52,939 KTOE Commercial Energy NRE National Agenda 8% (6,540 KTOE) 81% Cabinet Resolution on June 8, 2004 2011 81,763 kTOE 2554 81,753 KTOE
Strategy for Renewable Energy Development Target and Strategy of RE Electricity RPS 437 MW - Solar - Wind - MSW - Biomass - Hydro INCENTIVE Electricity Solar 6 MW Wind 0.2 MW Biomass 560 MW RPS Incentive 1,093 MW Heat (Incentive) 3,700 KTOE RE 8% Heat ~ 0.00 KTOE RE 0.5% Bio Fuel (Incentive) 1,800 KTOE Ethanol 3.0 M liters/D Bio diesel 4.0 M liters/D Bio fuel ~ 0.00 KTOE R & D Facilitator 2002 2011
Biodiesel Strategic Plan 2004 2005 2006 2009 2007 2008 2010 2011 Research Demonstration Incentive (Biodiesel Community base) Biodiesel Mandate 10% Blend Phase I: Specified areas Phase II: Whole country Prod. Cap. 4.0 mill.lt/d Specification of B100 & B5, B10 Industrial based Biodiesel Development Community based Biodiesel Pilot Project Development
Farmers 60,000 Rai Blending Facilities Biodiesel Plant Extraction Plant Other Products Power Plant Biodiesel : Business Model Business Feasibility 100,000 Liters/day Will produce in the 4th year and last 21 years Glycerin Oleochemical Vitamin A,E Biodiesel Complex Value-added
Biodiesel and Communities Biodiesel Factory Electricity as Biofuels by-product • Potential for rural off-grid electricification Distributed Generation • Renewable energy source for power generation Crushing Factory Power Plant Biodiesel Complex Small-scale Biodiesel Project • Biodiesel production for using in community
Opening Ceremony for Community Based Biodiesel Researching and Developing – Chiang Mai First in Thailand and ASEAN
Gasohol Strategic Plan Ethanol 1.0 mill. lts /d Ethanol 3.0mill. lts /d 2004 2005 2006 2007 2008 2009 2010 2011 Phase I MTBE replacement Phase II Gasohol Mandate Formulate policy on utilizing High Performance Vehicles for E10 and FFV Formulated policy on fade out MTBE in ULG 95 and promote Gasohol 91 in some areas • Spec. of Gasohol 95 & 91 • Emission test on using Gasohol 95 • Defined gasohol use in Spec. of newvehicle procurement • Requested governments’ vehicles to refill gasohol • Enforced government fleets use Gasohol • Gas stations in govern. must sell Gasohol
National Ethanol Program Promoting E-10 Gaining popularity and Already replace 25% of ULG 95 Compulsory Measures Compulsory distribution of E-10 on an national scale on Jan 1st 2007 Good cooperation with oil companies Expanding station to 4,000 by 2005 Increase Outlets Price Diff. by 0.4 Euro Demand by 4 times Pricing Policy
Ethanol – Gasohol Target December 2005 • Expanding gasohol station from 2,171 * stations to 4,000 stations nationwide • Gasohol 2.8 * to 4 million litre/day ( * as of Sep. 05) 1 January 2007 • Gasohol 95 nationwide, remove gasoline 95 from the market 2008 • Using gasohol 91 and 95 nationwide Price Incentive - Gasohol is cheaper than the premium gasoline by 1.50 baht
Ethanol plant location Ethanol plants 1st Phase(1.09 Mill. lts /day) • 3 existing ethanol plants total production cap. 0.375 Mill. lts /day • 3 plants under construction total cap. 0.715 Mill. lts/day 2nd Phase(3.2 Mill. lts /day) 18plants were approved: • 14sugar mills& • 4cassava mills 1st Phase Molasses Cassava 2nd Phase Sugar cane juice & Molasses Cassava No direct relation between sugar sector and distillery
SolarCell Strategic Plan • Incentive (72 MW) • Feed In Tariff • Soft loan • Tax Incentive Remote Area (38 MW) Stand alone System RPS (140 MW) 250 MW 2005 2004 2006 2007 2008 2010 2011 2009 • R&D • Increase Local Content Percentage • Reduce PV System Price Solar Cell Industry
Status of PV Installation in Thailand: End of the Year 2003 • As of 2003, approximately 6 MW of PV systems have been installed. • Water pumping 1.14 MW • Stand-alone systems 0.26 MW • Battery charging 2.17 MW • Telecommunication 1.50 MW • Schools 0.30 MW • Hospitals 0.02 MW • Ocean navigators 0.02 MW • Grid-connected systems 0.31 MW • Miscellaneous 0.13 MW Source: Dusit Kruangam, et.al., Pre-Feasibility Study on Solar Cell Production in Thailand, Technical Digest of the International PVSEC-14, Bangkok, Thailand, 2004. • EGAT, by April 2004, has been conducting the biggest Grid-Connected system of 0.5 MW in Mae Hong Son. • Newly government-initiated project, Solar Home System for 200,000 unelectrified houses in Thailand, of 24 MW will be conducted between 2004 (150,000 sets 120 Wp each in the first phase) and 2005 (50,000 sets in the second phase). • It is expected that the PV market after 2007 will grow at the rate of 50 MW per year.
PV Market Trend in Thailand • Newly government-initiated project, Solar Home System for 200,000 unelectrified houses in Thailand, of 24 MW will be conducted between 2004 (150,000 sets 120 Wp each in the first phase) and 2005 (50,000 sets in the second phase). • Implementation of a Renewable Portfolio Standard (RPS) would enforce IPPs (independent power producers) as well as SPPs (small power producers) to generate electricity from renewable energy sources. • Net metering with government incentives will also be implemented. • It is expected that the PV market after 2007 will grow at the rate of 50 MW per year.
Tool to Overcome Barriers • Need government strongly support and encouragement to drive ethanol market • Clear policy and target • Market drive; • Incentive; • Specification. • Cooperation from all parties concerned • Car manufacturers; • Oil refineries and oil distributors; • Industries i.e. sugar mills, CPO mills, starch mills • Farmers and cooperatives.
Renewable Energy PromotionProgram • Former Projects - Small Power Producers(SPP)Project (1st) - SPP Project (2nd) • Ongoing Project - Very Small Power Producers(VSPP) Project • Future Projects - Renewable Portfolio Standard (RPS) - Incentivei.e.Feed-in Tariff &Tax Holidays - VSPP (Capacity Expansion)
Energy conservation Strategies and Programs • Energy Intensity • Target of Energy Efficiency • Highlighted Programs • Compulsory Program • Cooperative Efforts • Revolving Fund • Tax Incentives
Energy Intensity (Compare with Developed Countries) Thailand USA UK Germany Japan
Energy Intensity (Compare with Developing Countries)
Ratio of energy growth rate to GDP growth rate = 1.0 by 2008 Energy Efficiency Improvement Target Strategy Indicators Objective 1 Energy Efficiency Improvement 1. Improve EE in Transportation Energy Elasticity = 1:1 in 5 years 2. Improve EE in Industry 2 3. Awareness raising campaign ประเทศไทยมีพลังงานใช้อย่างต่อเนื่อง เพียงพอต่อความต้องการไปอีก 50 ปี Energy Elasticity = ∆tEnergy Consumption/ ∆tGDP 3 ประชาชนมีพลังงานใช้อย่างทั่วถึง ในราคาที่เป็นธรรมและเพื่อคุณภาพชีวิตที่ดีขึ้น Ave. Energy Elasticity 1.4 : 1.0 4 ประเทศไทยเป็นศูนย์กลางพลังงานในภูมิภาค
Create Conducive Environment for EE Investment Customer Service Low Interest Source of Fund Access to Funds Workshop & Training Technical Assistance Grant for small investment Free Energy Audit and consulting Incentives & Subsidies Regulations Energy Codes Tax Incentives Raise up Confidence Perfect Information List Of Experts Promotion Campaign Promotion of ESCOs Directory of Technology Providers Demonstration Project
Energy Energy Intensity = GDP Industrial and Building sector Programs Strategy Objective 1 • Cooperate with Ministry of Industry to change industrial structure to be less energy intensive • Support by energy conservation promotion programs • Regulation • Incentives, subsidies • Soft loans for EE investment • Technical assistance • Research and development • Training, capacity development • Tax Incentives • Tax breaks for ESCOs • Import duty exemption for high energy efficient products, machines • Performance-based incentives 2. Improve EE in Industrial and building Sector Improve end-use energy efficiency 2 ประเทศไทยมีพลังงานใช้อย่างต่อเนื่อง เพียงพอต่อความต้องการไปอีก 50 ปี ทิศทางและมาตรการ ยังไม่ชัดเจน 3 ประชาชนมีพลังงานใช้อย่างทั่วถึง ในราคาที่เป็นธรรมและเพื่อคุณภาพชีวิตที่ดีขึ้น Basic Metal Chemical Fabricated Metal 4 Food and Beverages ประเทศไทยเป็นศูนย์กลางพลังงานในภูมิภาค (ปี 2524 = 100) Non Metalic Textiles Paper
Compulsory Program • Over 1 MW peak demand or consume more than 20 TJ annually • More than 4000 large buildings and factories (so called Designated Facilities) • Mandatory Tasks • Assign Energy Manager • Report Monthly Energy Use • Develop EE Target and Plan • Compile all energy codes
Cooperative Efforts on Energy Management • Objective: Sustainable energy management through internal cooperative efforts • Methodologies • Educate on concept & method + evaluation • Help create and implement EC measures • Achievement • Implemented factory 95 plants • Introduced house-keeping measures • Energy saving of 5-10% for each facility ( simple payback of 2.5 yrs)
Revolving Fund for EC Projects Present Status • 79 approved and under • construction projects • with leverage 80 million • USD of EC Investment • Average investment 1 mill USD / a project & • average payback 2.3 yrs • Annual savings > 250 GWh • and 91 mill. liter of fuel oil • Budgets allocation from ECP Fund • Loan approval by Bank • Technical assistance by DEDE • Key conditions • Loan size < 1.2 mill USD/project • Interest rate less than 4% (fixed rate) • Repayment in the defined time frame (7yr)
Cost Based Tax Incentive • 25% Tax Break for the Investment in EE Projects Result in Efficiency Improvement • Applicable for the First 50 mill baht Investment ( 1.25 mill USD ) • Incentive Spread Over 5 Years
Performance Based Tax Incentive • 100% of achieved energy saving will become tax deduction • Max Incentive of 2 mill baht (50,000 USD) / Facility • Pre and Post Audit will be required
Incentive through Board of Investment ( BOI ) • Import duties and Cooperate tax exemption on new investment in • Energy conservation business • High efficiency machine or equipment and renewable energy equipment manufacturing • Solar PV manufacturing • Energy Service Company – ESCO • Renewable energy production business • Alcohol or fuels from agricultural products • Electricity or steam generation • Incentive last for the max period of 8 years
Promotion of ESCOs • BOI – Tax Incentive • Maximum 8 years tax exemption for ESCO projects – Cooperate Income tax • Access to Revolving Fund • Eligible to borrow the low-interest loan from RF program on project-by-project basis • ESCO promotion activities • Website • Seminars, workshop • Publications • Lists of ESCOs and successful cases
Holistic Approach ปรับกระบวนทัศน์ เปลี่ยนโครงสร้าง เพิ่มมูลค่า Paradigm Shift Enforcer / Regulator Facilitator / Supporter
EE in Residential Sector • Promotion on energy efficient houses Provide 3 different models of energy efficient houses with a focus on • Housing design ( Site allocation / Shape ) • Roof design • Walls • Floor • Ceiling • Openings ( Door and Windows ) • Sunshade Equipment • Ventilation • Natural light utilization
Model Electricity Cost Total (kwh/year) Estimated Saving (kwh/year) A/C system (kwh/year) Lighting (kwh/year) • 1. Model A • One-storey • 84 sq.m. • 17,000 USD Conventional design 6,499 1,125 7,624 27.3 % New design 4,420 1,125 5,545 • 2. Model B • Two-storey • 135 sq.m. • 33,600 USD 10,293 2,422 12,751 19.9 % New design 7,350 2,422 9,772 • 3. Model C • Two-storey • 183 sq.m. • 40,800 USD 13,353 3,386 6,739 29.5 % 10,126 3,386 13,512 Energy saving estimation Conventional design Conventional design New design
On going projects for Residential • Promoting Energy Efficiency Housing • Single Family Houses • Townhouses • The Study of Building Codes for Energy Efficiency House and Buildings with the Promotional Scheme
กรมพัฒนาพลังงานทดแทนและอนุรักษ์พลังงาน More InformationVisitwww.dede.go.th Thank you