Previous Lecture : Exploring Data
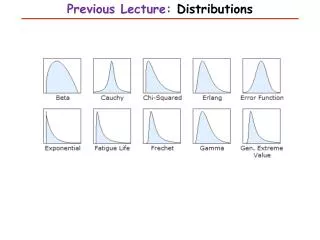
Previous Lecture : Exploring Data. This Lecture. Introduction to Biostatistics and Bioinformatics Descriptive Statistics. Process of Statistical Analysis. Population. Random Sample. Make Inferences. Describe. Sample Statistics. Distributions. Normal. Skewed. Long tails. Complex.

Previous Lecture : Exploring Data
E N D
Presentation Transcript
This Lecture Introduction to Biostatistics and Bioinformatics Descriptive Statistics
Process of Statistical Analysis Population Random Sample Make Inferences Describe Sample Statistics
Distributions • Normal • Skewed • Long tails • Complex
Randomly Sample from any Distribution Generate a pair of random numbers within the range. Assign them to x and y Keep x if the point (x,y) is within the distribution. Repeat 1-3 until the desired sample size is obtained. The values x obtained in this was will be distributed according to the original distribution.
Mean Sample Mean
Mean • Normal • Skewed • Long tails • Complex • 1 • -1 • 0.2 • -0.2 • 100 Sample Size
Median, Quartiles and Percentiles Sample Quartiles for 25% of the sample for 50% of the sample (median) for 75% of the sample Inter Quartile Range Percentiles for m% of the sample
Median and Mean • Normal • Skewed • Long tails • Complex • 1 Median - Gray • -1 • 0.2 • -0.2 • 100 Sample Size
Quartiles and Mean • Normal • Skewed • Long tails • Complex • 1 Q3 - Purple Q1 – Gray • -1 • 0.2 • -0.2 • 100 Sample Size
Central Limit Theorem • The sum of a large number of values drawn from many distributions converge normal if: • The values are drawn independently; • The values are from the one distribution; and • The distribution has to have a finite mean and variance.
Variance Sample Mean Variance
Variance • Normal • Skewed • Long tails • Complex • 0.6 • 0 • 0.1 • 0 • 100 Sample Size
Inter Quartile Range and Standard Deviation • Normal • Skewed • Long tails • Complex • 1.0 IRQ/1.349 - Gray • 0 • 0.4 • 0 • 100 Sample Size
Uncertainty in Determining the Mean • Normal • Skewed • Long tails • Complex • n=3 • n=3 • n=3 • n=10 • n=100 • n=10 • n=10 • n=10 • n=1000 • n=100 • n=100 • n=100 Average
Standard Error of the Mean Sample Mean Variance Standard Error of the Mean
Error bars In 2012, error bars appeared in Nature Methods in about two-thirds of the figure panels in which they could be expected (scatter and bar plots). The type of error bars was nearly evenly split between s.d. and s.e.m. bars (45% versus 49%, respectively). In 5% of cases the error bar type was not specified in the legend. Only one figure used bars based on the 95% CI. None of the error bar types is intuitive. An alternative is to select a value of CI% for which the bars touch at a desired P value (e.g., 83% CI bars touch at P = 0.05). M. Krzywinski & N. Altman, Error Bars, Nature Methods 10 (2013) 921
Box Plot M. Krzywinski & N. Altman, Visualizing samples with box plots, Nature Methods 11 (2014) 119
Box Plots • Normal • Skewed • Long tails • Complex • n=5 • n=5 • n=5 • n=5 • n=10 • n=10 • n=10 • n=10 • n=100 • n=100 • n=100 • n=100
Box Plots with All the Data Points • Normal • Skewed • Long tails • Complex • n=5 • n=5 • n=5 • n=5 • n=10 • n=10 • n=10 • n=10 • n=100 • n=100 • n=100 • n=100
Box Plots, Scatter Plots and Bar Graphs • Normal Distribution • error bars: standard deviation • Error bars: standard deviation • error bars: standard error • error bars: standard error
Box Plots, Scatter Plots and Bar Graphs • Skewed Distribution • error bars: standard deviation • Error bars: standard deviation • error bars: standard error • error bars: standard error
Box Plots, Scatter Plots and Bar Graphs • Distribution with Fat Tail • error bars: standard deviation • Error bars: standard deviation • error bars: standard error • error bars: standard error
Application: Analytical Measurements Measured Concentration Theoretical Concentration
A Few Characteristics of Analytical Measurements Accuracy: Closeness of agreement between a test result and an accepted reference value. Precision: Closeness of agreement between independent test results. Robustness:Test precision given small, deliberate changes in test conditions (preanalytic delays, variations in storage temperature). Lower limit of detection: The lowest amount of analyte that is statistically distinguishable from background or a negative control. Limit of quantification: Lowest and highest concentrations of analyte that can be quantitatively determined with suitable precision and accuracy. Linearity: The ability of the test to return values that are directly proportional to the concentration of the analyte in the sample.
Coefficient of Variation Sample Mean Variance Coefficient of Variation (CV)
Lower Limit of Detection The lowest amount of analyte that is statistically distinguishable from background or a negative control. Two methods to determine lower limit of detection: Lowest concentration of the analyte where CV is less than for example 20%. Determine level of blank by taking 95th percentile of the blank measurements and add a constant times the standard deviation of the lowest concentration. K. Linnet and M. Kondratovich, Partly Nonparametric Approach for Determining the Limit of Detection, Clinical Chemistry 50 (2004) 732–740.
Limit of Detection and Linearity Measured Concentration Measured Concentration Theoretical Concentration Theoretical Concentration
Precision and Accuracy Measured Concentration Measured Concentration Theoretical Concentration Theoretical Concentration
Descriptive Statistics - Summary • Example distribution: • Normal distribution • Skewed distribution • Distribution with long tails • Complex distribution with several peaks • Mean, median, quartiles, percentiles • Variance, Standard deviation, Inter Quartile Range (IQR), error bars • Box plots, bar graphs, and scatter plots • Application: Analytical measurements: • Accuracy and precision • Limit of detection and quantitation • Linearity • Robustness
Descriptive Statistics – Recommended Reading http://blogs.nature.com/methagora/2013/08/giving_statistics_the_attention_it_deserves.html
Descriptive Statistics – Recommended Reading http://greenteapress.com/thinkstats/
Next Lecture: Data types and representations in Molecular Biology GFF3 FASTA ##gff-version 3 #!gff-spec-version 1.20 ##species_http://www.ncbi.nlm.nih.gov/Taxonomy/Browser/wwwtax.cgi?id=7425 NC_015867.2 RefSeqcDNA_match 66086 66146 .- . ID=aln0;Target=XM_008204328.1 1 61 +; for_remapping=2;gap_count=1;num_ident=8766;num_mismatch=0;pct_coverage=100;pct_coverage_hiqual=100;pct_identity_gap=99.9886;pct_identity_ungap=100;rank=1 NC_015867.2RefSeqcDNA_match 65959 66007 .- . ID=aln0;Target=XM_008204328.1 62 110 +;for_remapping=2;gap_count=1;num_ident=8766;num_mismatch=0;pct_coverage=100;pct_coverage_hiqual=100;pct_identity_gap=99.9886;pct_identity_ungap=100;rank=1 NC_015867.2RefSeqcDNA_match 65799 65825 .- . ID=aln0;Target=XM_008204328.1 111 137 +;for_remapping=2;gap_count=1;num_ident=8766;num_mismatch=0;pct_coverage=100;pct_coverage_hiqual=100;pct_identity_gap=99.9886;pct_identity_ungap=100;rank=1 >URO1 uro1.seq Length: 2018 November 9, 2000 11:50 Type: N Check: 3854 .. CGCAGAAAGAGGAGGCGCTTGCCTTCAGCTTGTGGGAAATCCCGAAGATGGCCAAAGACAACTCAACTGTTCGTTGCTTCCAGGGCCTGCTGATTTTTGGAAATGTGATTATTGGTTGTTGCGGCATTGCCCTGACTGCGGAGTGCATCTTCTTTGTATCTGACCAACACAGCCTCTACCCACTGCTTGAAGCCACCGACAACGATGACATCTATGGGGCTGCCTGGATCGGCATATTTGTGGGCATCTGCCTCTTCTGCCTGTCTGTTCTAGGCATTGTAGGCATCATGAAGTCCAGCAGGAAAATTCTTCTGGCGTATTTCATTCTGATGTTTATAGTATATGCCTTTGAAGTGGCATCTTGTATCACAGCAGCAACACAACAAGACTTTTTCACACCCAACCTCTTCCTGAAGCAGATGCTAGAGAGGTACCAAAACAACAGCCCTCCAAACAATGATGACCAGTGGAAAAACAATG FASTQ @SRR350953.5 MENDEL_0047_FC62MN8AAXX:1:1:1646:938 length=152 NTCTTTTTCTTTCCTCTTTTGCCAACTTCAGCTAAATAGGAGCTACACTGATTAGGCAGAAACTTGATTAACAGGGCTTAAGGTAACCTTGTTGTAGGCCGTTTTGTAGCACTCAAAGCAATTGGTACCTCAACTGCAAAAGTCCTTGGCCC +SRR350953.5 MENDEL_0047_FC62MN8AAXX:1:1:1646:938 length=152 +50000222C@@@@@22::::8888898989::::::<<<:<<<<<<:<<<<::<<:::::<<<<<:<:<<<IIIIIGFEEGGGGGGGII@IGDGBGGGGGGDDIIGIIEGIGG>GGGGGGDGGGGGIIHIIBIIIGIIIHIIIIGII @SRR350953.7 MENDEL_0047_FC62MN8AAXX:1:1:1724:932 length=152 NTGTGATAGGCTTTGTCCATTCTGGAAACTCAATATTACTTGCGAGTCCTCAAAGGTAATTTTTGCTATTGCCAATATTCCTCAGAGGAAAAAAGATACAATACTATGTTTTATCTAAATTAGCATTAGAAAAAAAATCTTTCATTAGGTGT +SRR350953.7 MENDEL_0047_FC62MN8AAXX:1:1:1724:932 length=152 #.,')2/@@@@@@@@@@<:<<:778789979888889:::::99999<<::<:::::<<<<<@@@@@::::::IHIGIGGGGGGDGGDGGDDDIHIHIIIII8GGGGGIIHHIIIGIIGIBIGIIIIEIHGGFIHHIIIIIIIGIIFIG
Next Tutorial: Python Programming Saturday 9/13 at 3 PM in TRB 120