Download
1 / 32
320 likes | 334 Vues
Analytical comparison of scenarios in BE-AWARE project regions regarding environmental and socio-economic damage reduction and cost efficiency. Explore key terms and rankings for different sub-regions for better disaster preparedness and risk management.

E N D
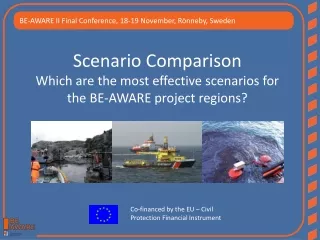
BE-AWARE II Final Conference, 18-19 November, Rönneby, Sweden Scenario ComparisonWhich are the most effective scenarios for the BE-AWARE project regions? Co-financed by the EU – Civil Protection Financial Instrument
Concept for analytical scenario comparison Concept for analytical scenario comparisonCosts are given as order of magnitudes and include investment cost, lifetime, maintenance and running costs
Concept for analytical scenario comparison • Introducing two key terms: • 1) Effectiveness (regarding damage for a given scenario compared to the 2020 reference scenario) • In brief: "How much is the env. and soc.-eco. damage reduced in a sub-region by introducing a given scenario?" • In brief brief: "How much does it help" • 2) Cost-efficiency • (regarding damage for a given scenario compared to the 2020 reference scenario) • In brief: "How much reduction in env. and soc.-eco. damage is achieved per invested EUR in a sub-region by introducing a given scenario?" • In brief brief :"How much do I get per EUR"
Concept for analytical scenario comparison Environmental and socio-economic damage Effectiveness expressed by env. and soc.eco damage is qualitatively confirmed by effectiveness expressed by thee independent parameters
Ireland and UK • Sub-Region 1: Irish Sea and Atlantic
Effectiveness in reducing damage impact • Sub-Region 1: Irish Sea and Atlantic
Sub-Region 1: Irish Sea and Atlantic Cost-efficiencyin reducing damage impact
Cost-efficiency: Ranking of scenarios regarding reducing damage • Sub-Region 1: Irish Sea and Atlantic
Summary Sub-region 1 (first 3 ranks are colored) • Sub-Region 1: Irish Sea and Atlantic *) Spill-over effect from neighbouring sub-regions
Norway and UK • Sub-Region 2: Northern North Sea
Effectiveness in reducing damage impact • Sub-Region 2: Northern North Sea
Sub-Region 2: Northern North Sea Cost-efficiencyin reducing damage impact
Sub-Region 2: Northern North Sea Cost-efficiency: Ranking of scenarios regarding reducing damage
Sub-Region 2: Northern North Sea Summary Sub-region 2 (first 3 ranks are colored) *) Spill-over effect from neighbouring sub-regions
Denmark, Germany, Norway and Sweden • Sub-Region 3: Eastern North Sea/Skagerrak
Sub-Region 3: Eastern North Sea/Skagerrak • Effectiveness in reducing damage impact
Sub-Region 3: Eastern North Sea/Skagerrak Cost-efficiencyin reducing damage impact
Cost-efficiency: Ranking of scenarios regarding reducing damage • Sub-Region 3: Eastern North Sea/Skagerrak
Sub-Region 3: Eastern North Sea/Skagerrak Summary Sub-region 3 (first 3 ranks are colored)
Belgium, France, Germany, Netherlands and UK • Sub-Region 4: Southern North Sea
Sub-Region 4: Southern North Sea • Effectiveness in reducing damage impact
Sub-Region 4: Southern North Sea Cost-efficiencyin reducing damage impact
Sub-Region 4: Southern North Sea Cost-efficiency: Ranking of scenarios regarding reducing damage
Sub-Region 4: Southern North Sea Summary Sub-region 4 (first 3 ranks are colored)
France and UK • Sub-Region 5: Channel
Sub-Region 5: Channel • Effectiveness in reducing damage impact
Sub-Region 5: Channel Cost-efficiency: Ranking of scenarios regarding reducing damage
Sub-Region 5: Channel Summary Sub-region 5 (first 3 ranks are colored) *) Spill-over effect from neighbouring sub-regions
Concept for analytical scenario comparison Environmental values at stake: Sub-region 1: 2.500 (tonnes oil weighted) Sub-region 2: 2.500 (tonnes oil weighted) Sub-region 3: 18.000 (tonnes oil weighted) Sub-region 4: 80.000 (tonnes oil weighted) Sub-region 5: 6.000 (tonnes oil weighted)
Concept for analytical scenario comparison Concept for analytical scenario comparisonCosts are given as order of magnitudes and include investment cost, lifetime, maintenance and running costs
Thank youbeaware.bonnagreement.org Questions?