Download
1 / 47
490 likes | 527 Vues
Dive into the fundamentals of the BOLD signal, from Nuclear Magnetic Resonance to the physiology behind it. Explore the alignment of hydrogen atoms, precession of protons, relaxation times, BOLD contrast, neurovascular coupling, and physiological factors influencing the interpretation of BOLD signals.

E N D
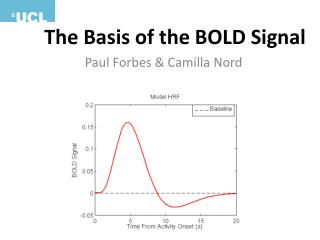
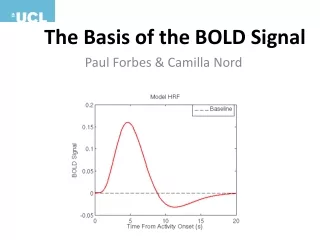
The Basis of the BOLD Signal Paul Forbes & Camilla Nord
Outline • Physics (Paul) • Physiology (Camilla)
BOLD and NMR • To understand the basis of the BOLD signal we first need to understand Nuclear Magnetic Resonance (NMR)
Nuclear Magnetic Resonance • Nuclear • Magnetic • Resonance
Nuclear Magnetic Resonance • Nuclear • Magnetic • Resonance
Human body Fat and water (tissue) Hydrogen atoms Hydrogen nucleus Single proton SPIN
Nuclear Magnetic Resonance • Nuclear • Magnetic • Resonance
What is spin? • A magnetic quantity that gives the proton a small magnetic field around it • Thus, the proton produces a nuclear magnetic resonance (NMR) signal • We have lots of spins so we can describe them with classical mechanics (not quantum mechanics - see Ehrenfest theorem)
Alignment of spin • In the absence of an external magnetic field the nuclei will point in random directions • Upon the application of a field the nuclei align either parallel of anti-parallel with the fields B0
Alignment of spin • Some align “spin up” and some align “spin down” • Spin up = high energy state / unstable • Spin down = low energy state / stable
Precession • Protons precess when aligned in a field • The spin vector rotates around the direction of the external field
Larmor Frequency Angular frequency at which the nuclei precess = Larmor frequency, External magnetic field strength gyromagnetic ratio The frequency of precession (in Hz) depends on the magnetic field strength
Nuclear Magnetic Resonance • Nuclear • Magnetic • Resonance
Nuclear Magnetic Resonance • Nuclei are aligned and precessing • Pulse of electromagnetic radiation is applied - radio frequency pulse • The frequency of this pulse exactly matches the frequency of precession (Larmor frequency)
Nuclear Magnetic Resonance • Nuclei in the low energy state absorb this energy and flip to the high energy state (“spin up”) – phase transition • They also precess in phase with each other • Resonance effect
Nuclear Magnetic Resonance • The nuclei precessing in phase is fundamental to MRI signal B0 Btranverse as it sets up a tranverse magnetic field which forms the basis of the MRI signal
Physics to physiology - so why is this significant in terms the BOLD signal?
Relaxation • In terms of fMRI we are interested in the apparent relaxation time T2* • This occurs when the spins dephase • We are interested in the rate at which the spins dephase (desync)
The BOLD signal • oxyHb is diamagnetic = slow dephasing / T2* • deoxyHb is paramagnetic = fast dephasing / T2*
1. BOLD Contrast (Nick Todd) Oxygenated Hb B0 voxel Vessel Tissue Deoxygenated Hb 21
1. BOLD Contrast (Nick Todd) Oxygenated Hb B0 voxel Vessel Tissue Deoxygenated Hb 22
1. BOLD Contrast (Nick Todd) Oxygenated Hb B0 voxel Vessel Tissue Deoxygenated Hb 23
1. BOLD Contrast (Nick Todd) Oxygenated Hb B0 voxel Vessel Oxygenated Hb Tissue BOLD Contrast Deoxygenated Hb Deoxygenated Hb 24
Key determinants of the BOLD signal Arthurs & Boniface, 2002
Questions Basis of BOLD signal: action potentials or LFPs? Implications of neurovascular coupling, capillaries vs veins, and other physiological factors on interpretation of BOLD signal Interpretations: How is inhibitory neuronal activity reflected? And how does one interpret a negative BOLD signal?
Vascular basis of BOLD signal • = Neural activity-dependent changes in relative concentration of oxygenated and deoxygenated blood • Deoxyhaemoglobin is paramagnetic (as decreases, causes increase in BOLD signal), unlike oxygenated haemoglobin • Paradox? → CBF • Decoupling more O2 provided than neccessary • Varies widely across cortical areas; between species. What if it varied between the groups you were testing?
Additional physiological factors • blood volume • vascular geometry • haematocrit • basal oxygenation levels • ‘brain vs vein debate: capillary vs large draining veins downstream from neuronally active regions • could displace signal changes Spin-echo fMRI technique minimizes, but decreased StN ratio Relative contribution to T2* weighted GRE fMRI from capillaries vs. larger blood vessels (veins) as a function of the frequency on the vessel wall for a cylinder mimicking blood vessels. (Ugurbil, 2011)
Does the BOLD signal reflect energy demands? • Originally thought that increase in blood flow due to energy requirements • But most of energy used in post-synaptic signalling; maintaining APs • So…energy use does not directly increase blood flow • Increase in glucose and O2 demands causes release of vasodilators • Adenosine • Arachidonic Acid metabolites • Nitric Oxide (NO) • Global blood flow changes also associated with DA, NA, 5-HT (Attwell & Iadecola, 2002)
Does the BOLD signal reflect firing rate? • V5 neurons- direction-specific • fMRI responses in MT+ also increase linearly with motion coherence (field of moving dots) • Proportional to the slopes of single-neuron firing rates in monkeys fMRI responses in human V1 are proportional to average firing rates in monkey V1. (Rees et al, 2000; Heeger at al, 2000)
Or does it reflect another neural property? • i.e., APs or LFPs? • Logothetis et al 2001: Simultaneous intracortical recordings of neural signals & fMRI responses • Largest magnitude changes in LFP correlated with haemodynamic response BOLD signal reflects input and intracortical processing.
BOLD signal/AP correlation depends on location! Rees/Heeger findings resulted from recordings in areas where inputs, intracortical activity, and outputs (recordings) are all highly correlated, so all increase with stimulus contrast Would not have worked in other areas, such as…
Cerebellar APs and the BOLD signal • GABA-A receptor blockade in rats • Increase in spiking activity (Purkinje cells) • caused no change in neurovascular coupling that forms basis of BOLD signal • || fibre stimulation causes increase in BOLD, inhibit Purkinje cells Effect of picrotoxin on evoked cerebellar blood flow responses, local field potentials, synaptic activity, and neurovascular coupling during inferior olive stimulation (Thomsen et al, 2004)
One possible explanation: Ca2+ Excitation increases Ca2+ Inhibition decreases Ca2+ …but not always, depending on inhibitory interneuron and its complement of enzymes & vasoactive substances, e.g. cerebellum (INs increase blood flow because of high NO content)
Why does this matter? • Implications for group differences in patient studies (as well as differences between neural regions, development ages, etc.- anything you can think of) • Concerns over interpretation of BOLD response in autism • Alterations in signalling pathways (eg, NO), neurotransmitter differences • potential for nonlinear shifts in BOLD response • Signalling changes- changes in BOLD w/o neuronal changes Reynell & Harris 2013
Interim summary • fMRI BOLD signals are dependent on variability and inter-relationships of several factors. • This includes multiple cellular mechanisms that could affect vasodilation other than direct neuronal activity, and is relevent for studies examining group differences • Debate currently favours relatively direct correlation between fMRI signals and population synaptic activity (including inhibitory and excitatory activity) with a secondary and potentially more variable correlation with cellular action potentials.
What about inhibitory activity? Majority of cortex = pyramidal cells Hypothesis: inhibitory cells do not produce change in BOLD because lower metabolic demand from increased efficiency Figure: Left column, primary motor cortex, ‘no go condition’ show no change from baseline, comp to pre-SMA. (Waldfogel et al, 2000). Recent model: inhibition increases BOLD if low level of excitation, but reduces when excitation high- can explain contradictory results (Tagamets & Horowitz, 2001) More complex than this?
Is inhibition just reflected as a negative BOLD signal? • Unknown. • Motor and visual cortices show NBR as a result of neuronal inhibition • Many claim that NBR = inhibitory activity • Monkey V1 show NBR corresponds with decreased population spiking (comb fMRI/electrophys) • Cannot draw conclusions without understanding intrinsic correlation • BUT is there another explanation? Example of seizures. • Cortex vs subcortical dissocation? • Schridde et al, 2008
Intrinsic connectivity What is the majority of the brain’s energy devoted to? • NOISE (spontaneous fluctuations in the BOLD signal) • Synchrony/coherence with anatomically and functionally connected regions • Potential for clinical biomarkers • Techniques: seed-based (AD hippocampal connectivity); ICA (MDD subgenual cingulate). Zhang & Raichle, 2010
The ‘Default Mode Network’ • Seminal meta-analysis suggested a baseline state of the human brain using PET (Raichle et al 2001) • Consistent reductions from this baseline observed in goal-directed behaviour (PET; fMRI). Temporary suspension? • Shown as a negative bold response (NBR) • Has spurred an entire field of research into rs-fMRI • A priori studies vs. model-based/data-driven
Designing an fMRI experiment • Because fMRI does not measure neural activity directly, we must quantifyrelative changes in activity • A typical fMRI experiment employs a task to examine differences in the BOLD signal (eg event-related) vs baseline (rest) • Timing of BOLD signal: intertime interval & jitter • What if there is no task?
Interpreting DMN results Grecius et al, 2007 Increased DMN functional connectivity with subgenual cingulate, thalamus, precuneus in MDD Interpretation: Treatment refractoriness, ‘biomarker’ Carhart-Harris et al, 2012 Increased DMN-task positive network coupling (normally orthogonal) after psilocybin Interpretation: ‘disturbed ego boundaries’, with implications for schizophrenia Cowdrey et al, 2012 Increased DMN functional connectivity in anorexia nervosa Blue= recovered AN group average Green= healthy control group Interpretation: rumination (precuneus) and inhibition (dlPFC)
Using the BOLD signal advantageously • 87% studies used conventional gradient-echo echoplanar imaging (rest, spin-echo) • can lead to localization errors without optimised protocol (e.g. pulse sequences) • Spatial specificity improves with increasing magnetic field strength Lawson et al, 2012 • Higher-resolution sequences available • Requires extensive collaboration with MR physicists • Do we need this for all studies? • “reading a newspaper with a microscope” • Logothetis, 2008
Next time you read an fMRI study • Are there other physiological effects that could have produced their result? • Vasodilation differences in region; disease state • What was their fMRI protocol? Was it high-res? If no, should it have been? • Do they report a negative BOLD signal? • What is their interpretation? Does it rely on APs or LFPs? • Depends on their region of interest! • Example critique: Conner et al (2013): Social proximity to a caregiver during a potentially stressful situation attenuated activity in the hypothalamus, VMPFC, and VLPFC (left) in clinically anxious youths.
Thank you Many thanks to Nikolaus Weiskopf for advice, and to you for your attention! Any questions?