Download
1 / 39
390 likes | 410 Vues
Basis of the BOLD Signal. Christoph Korn Andrea Dantas. Outline. fMRI Physics f M RI - Magnetic fields & spins fM R I - Radio pulse & relaxation times fMR I - Tissue contrasts f MRI - BOLD & T2* BOLD Signal Brain Metabolism Neural Basis of BOLD signal Technique & Protocols

E N D
Basis of the BOLD Signal Christoph Korn Andrea Dantas
Outline • fMRI Physics • fMRI - Magnetic fields & spins • fMRI - Radio pulse & relaxation times • fMRI -Tissue contrasts • fMRI - BOLD & T2* • BOLD Signal • Brain Metabolism • Neural Basis of BOLD signal • Technique & Protocols • Advantages & Disadvantages • Areas for future research
What do we want to understand? Singer et al., 2006
Which magnetic fields do we know? 1 Tesla = 20,000x Earth’s magnetic field
Where is the magnetic field in the scanner? B0 = constant magnetic field Along z-axis For fMRI 1.5T or 3T Z
Where are our compass needles? They can align to external magnetic fields in two ways: parallel or anti-parallel Protons have a spin and therefore a magnetic dipole moment MDM
What happens in the scanner? Outside scanner
What happens in the scanner? Inside scanner (B0) The protons of the H2O molecules in our body align along B0
Are there more up-spins than down-spins? Yes and the excess spins create a new magnetic field M which we can measure [T]
Do the spinning tops tumble? Precession and Larmor frequency ω = γ · B0 ω Larmor frequency γ gyromagnetic constant B0 static magnetic field e.g. 1.5 T ω = 64 MHz z-axis
How do we measure spins? We have to disturb them How? With a radiofrequency pulse with Larmor frequency
What happens if spins fall down? z axis x-y plane
What happens if spins fall down? z axis z axis x-y plane x-y plane 90° High frequency pulse before after
What is the T1 relaxation? Recovery in z-axis = longitudinal relaxation = spin-lattice relaxation Supplied energy lost Spins re-align with B0 T1
What is the T2 relaxation? Dephasing in x-y plane = horizontal relaxation = spin-spin relaxation 90° pulse T2 relaxation
Why does this happen and what is T2*? Two reasons for dephasing in x-y plane Spin-spin interaction T2 Local magnetic field inhomogeneities T2* Magnetic field inhomogeneities T2(*) time constant
And? How can we use this for imaging? Different tissues have different relaxation times Let’s look at T1 Fat White matter Grey matter CSF
And T2? Different tissues have different relaxation times CSF Grey matter White matter Fat
How do the T1 & T2 contrasts look like? Fat White matter Grey matter CSF
How do we get these contrasts? How do we get a 3D-image? Too much to explain here Different times between high frequency pulses Different gradients along magnetic field
Finally, what is BOLD? Blood Oxygen Level Dependent signal O2 is transported by haemoglobin (Hb)
What is the difference between deoxyHb and oxyHb? Remember T2* and field inhomogeneities? DeoxyHb paramagnetic strong field inhomogeneities Fast dephasing Fast T2* OxyHb diamagnetic weak field inhomogeneities Slower dephasing slower T2*
Better? Singer et al., 2006
Outline • fMRI Physics • fMRI - Magnetic fields & spins • fMRI - Radio pulse & relaxation times • fMRI -Tissue contrasts • fMRI - BOLD & T2* • BOLD Signal • Brain Metabolism • Neural Basis of BOLD signal • Technique & Protocols • Advantages & Disadvantages • Areas for future research
Brain Metabolism Review • Basic Facts • 54ml of blood / 100g of brain tissue • Brain: • 2-3% of body weight • 20% of O2 consumption • For imaging purposes, the main vasculature concerned are the capillaries networks– where glucose and O2 exchanges happen
Principles of BOLD • BOLD contrast depends on the balance between O2 supply and consumption by the neural tissues • DeoxyHb is paramagnetic – as its proportion decreases, the MR signal increases and generates what is referred to as the BOLD signal
Neural Basis of BOLD – Energy Consumption Theory • Initial thoughts were that increase of blood flow was due to the increase in energy requirements of the active tissue • Most of the energy is spent maintaining action potentials and in post-synaptic signalling • Inhibitory synapses use less energy than excitatory ones – controversy around whether these generate a BOLD signal at all!! Attwell, D. , Iadecola, C. 2002. “The neural basis of functional brain imaging signals”. Trends in Neuroscience. 25 (12) 621-625
Neural Basis of BOLD – Blood Flow Increase • Energy use does not directly increase blood flow…so how does the brain cope with the increase in glucose and O2 demands? • Glutamate-generated Calcium influx at post-synaptic level releases potent vasodilators: • Nitric Oxide • Adenosine • Arachidonic Acid metabolites • Blood flow is increased over an area larger than the one with neuronal activity • Global blood flow changes also associated with dopamine, noradrenaline and serotonin • Not related with regional energy utilisation at all!! Energy utilisation and increase in blood flow are processes that occur in parallel and are not causally related Attwell, D. , Iadecola, C. 2002. “The neural basis of functional brain imaging signals”. Trends in Neuroscience. 25 (12) 621-625
How can we (can we?) predict neural activity from fMRI signals? • 90.000 to 100.000 neurons per 1mm3 of brain tissue • 109 synapses, depending on cortical thickness
What is in a Voxel? • Volume of 55mm3 • Using a 9-16 mm2 plane resolution and slice thickness of 5-7 mm • Only 3% of vessels and the rest are….(be prepared!!) • 5.5 million neurons • 2.2-5.5 x 10¹⁰ synapses • 22km of dendrites • 220km of axons
What are we actually measuring? • Inputs or Outputs? • BOLD responses correspond to intra-cortical processing and inputs, not outputs • Aligned with previous findings related to high activity and energy expenditure in processing and modulation • Excitation or inhibition circuits? • Excitation increases blood flow, but inhibition might too – ambiguous data • Neuronal deactivation is associated with vasoconstriction and reduction in blood flow (hence reduction in BOLD signal) • And what about the awake, but resting brain? • Challenges in interpreting BOLD signal • Presence of the signal without neuronal spiking Logothetis, N. K. 2008, "What we can and cannot do with fMRI", Nature, vol. 453, pp. 869-877
fMRI Study Designs • Main types of study design: • Block design • Consecutive tasks in pre-defined time intervals (also referred to as “epochs”) • Event-related • Stimuli (events or trials) are presented • Higher image acquisition rates (1/sec) • 5 minutes of scanning can result in over 80 MB of data!
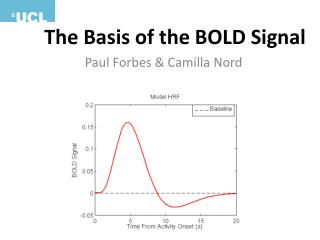
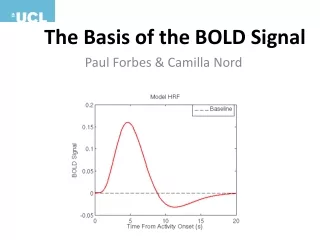
Delay between the stimulus and the vascular changes – might take up to 6 secs Initial “Dip” – decrease in BOLD signal due to O2 consumption Example of fMRI Protocol
fMRI Image ProcessingStages • Images are re-aligned • Spatial normalisation of images to a standard brain space • Smooth and normalise the data • Combine statistical maps with anatomical information Result is a superposition of a statistical map on a raw image
Advantages of BOLD • Advantages over other methods: • EEG / MEG – Poor spatial localisation, high number of electrodes needed • PET – Invasive and need to use potentially toxic contrast • Non-invasive • Increasing availability • High spatial and temporal resolution • Enables demonstration of entire network brain areas engaged in specific activities Logothetis, N. K. 2008, "What we can and cannot do with fMRI", Nature, vol. 453, pp. 869-877
Disadvantages of BOLD • Surrogate signal of haemodynamic activity – which has physical and biological constraints • Neuronal mass activity and not activity of specific neuronal units • Circuitry and functional organisation of the brain not fully understood • Difficult to differentiate between excitation/inhibition and neuromodulation • Signal intensity does not accurately differentiate between: • Different brain regions • Different tasks within the same region Logothetis, N. K. 2008, "What we can and cannot do with fMRI", Nature, vol. 453, pp. 869-877
Future Development Areas Multimodal approach is the way forward!!! • Coupling of electrophysiological studies with BOLD • Further improvements to fMRI technology • Expansion of human and animal experimentation, enhancing the comprehension of the neural basis of haemodynamic responses • New smart contrast agents that do not rely on haemoglobin
References Logothetis, N. K. 2008, "What we can and cannot do with fMRI", Nature, vol. 453, pp. 869-877 Attwell, D. , Iadecola, C. 2002. “The neural basis of functional brain imaging signals” Trends in Neuroscience. 25 (12) 621-625 Huettel, S. C., A. W. Song, and G. McCarthy. Functional Magnetic Resonance Imaging. 2nd ed. Sinauer Associates Inc., 2004 McRobbie, D.W., Moore, E.A., Graves, M.J., and Prince, M.R. MRI – From Picture to Proton. 2nd ed. Cambridge University Press, 2007 SIEMENS. Magnets, Spins and Resonance. 2003. 25-10-2008. Ref Type: Report