Understanding Population Growth Dynamics: Variability and Limits in Space and Time
Explore the intricate dynamics of population growth through the lens of variability and limitation in space and time. Learn about density dependence, intrinsic and extrinsic variability, source-sink structures, and the impact of migration. Discover the concepts of stability, equilibrium, and the factors influencing population growth rates. Dive into the complexities of logistic growth, carrying capacity, and the delicate balance between births, deaths, and environmental factors. Understand the implications of density dependence on mortality, reproduction, and survivorship, and how populations navigate growth constraints. Delve into new concepts like non-regulating and regulating growth, and examine the interplay of individual variation and environmental influences on population dynamics.

Understanding Population Growth Dynamics: Variability and Limits in Space and Time
E N D
Presentation Transcript
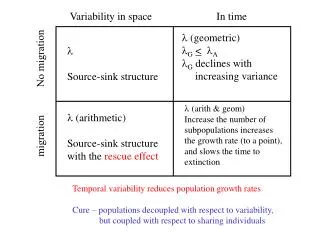
Variability in space In time • (geometric) • G<A G declines with increasing variance Source-sink structure No migration • (arith & geom) Increase the number of subpopulations increases the growth rate (to a point), and slows the time to extinction • (arithmetic) Source-sink structure with the rescue effect migration Temporal variability reduces population growth rates Cure – populations decoupled with respect to variability, but coupled with respect to sharing individuals
Overview of population growth: discrete continuous density independent Geometric Exponential Discrete Logistic X X density dependent Logistic • New Concepts: • Stability • DI (non-regulating) • vs. • DD (regulating) growth • equilibrium • Variability in growth • Individual variation in births and deaths • Environmental (extrinsic variability) • Intrinsic variability X
BUT, most populations appear more regulated than this….. And THERE ARE LIMITS TO GROWTH!!!! e.g., Australian sheep
Limits are manifested in (-) density dependence in population vital rates: mortality/survivorship reproduction
Density dependence often affects more than a single component of those rates: At higher densities, song sparrows: (a) smaller % reproductive males (b) fewer young fledged/female (c) lower juvenile survivorship
How do populations grow? Logistic Growth K dN dt (K-N) rN = population K N 1 dN N dt (K-N) = r per capita K time 1dN N dt 0 N K K = Carrying capacity: the maximum density of individuals that the environment can support
1 dN N dt (K-N) = r K (K-(0)) If N = 0 = r K K = r K = r
1 dN N dt (K-N) = r K N } (K-(0)) If N = 0 = r K Exponential growth-like time K = r K = r That’s Exponential Growth
1 dN N dt (K-N) = r K (K-(K)) If N = K = r K 0 = r K = 0
1 dN N dt (K-N) Zero growth = r K } K (K-(K)) If N = K = r N K 0 = r K = 0 time That’s Zero Growth
1 dN N dt (K-N) = r K K N Put the two together LOGISTIC GROWTH time
+ growth r 1 dN N dt 1dN N dt (K-N) = r 0 K N K - growth ( ) K _ N = r K K ( ) _ 1 = r 1 N K _ r = r N K Y = b + m X
2nd Simplest expression of population growth: 2 parameters: r = intrinsic growth rate and K = carrying capacity Per capita growth rate is (-) density dependent Second Law of Ecology:There are limits to growth
K N EQ stability regulation Log. Exp. time N time
Severe drought Rinderpest innoculation
So what about Density-dependence? Rainfall Total food per capita food
Lion/hyena killed 1.0 0.8 0.6 0.4 0.2 0.0 Solid, white fat Opaque gelatinous Translucent gelatinous Live wildebeest 1.0 0.8 Proportion of animals 0.6 0.4 0.2 0.0 Solid, white fat Opaque gelatinous Translucent gelatinous
To download a version of Populus: http//www.cbs.umn.edu/populus/download/download.html
Discrete Logistic Growth 600 500 500 400 400 Density 300 300 200 r=0.2 200 r=1.0 100 100 0 0 0 10 20 30 0 10 20 30 time 600 600 500 500 400 400 Damped oscillations 2-point limit cycle 300 300 200 200 r=1.8 r=2.0 100 100 0 0 0 10 20 30 0 10 20 30
1000 900 900 800 800 700 700 600 600 500 500 400 400 300 300 200 200 r=2.2 100 r=2.5 100 4-pt cycle 0 0 0 10 20 30 0 10 20 30 3000 1500 extinction Chaos r=2.8 r=4.0 2000 1000 1000 500 0 0 0 10 20 30 40 50 60 70 0 10 20 30 40 50 60 70
1500 120 100 1000 80 60 500 40 20 0 0 0 10 20 30 40 0 10 20 30 40 Chaos – “unpredictable” population dynamics incurred through very high growth rate and time lags between growth and negative feedback. 1500 Chaos r=2.8 1000 500 0 0 10 20 30 40 50 60 70 time Density Extrinsic variability time
K=1000; r=3.0 3000 2000 Density 1000 0 0 10 20 30 40 50 time
Islands < 1.0 ha support too few shrews to persist
Population culled by 25% K=1000; r=3.0 3000 3000 2000 2000 Density 1000 1000 0 0 0 10 20 30 40 50 0 10 20 30 40 50 time time
1500 120 100 1000 80 60 500 40 20 0 0 0 10 20 30 40 0 10 20 30 40 Extrinsic variability Population culled by 25% Density
Variability comes in 2 flavors: Extrinsic and Intrinsic Recognizing the type of variability is important because different types require different solutions. Intrinsic – growth rate or population size Extrinsic – migration, # populations, population size
Overview of population growth: discrete continuous density independent Geometric Exponential Discrete Logistic X X density dependent Logistic X X • New Concepts: • Stability • DI (non-regulating) • vs. • DD (regulating) growth • equilibrium • Variability in growth • Individual variation in births and deaths • Environmental (extrinsic variability) • Intrinsic variability X X
REVIEW • Cure: Dispersal from sources can • Rescue sinks • Cure: Many populations that share • individuals (dispersal) • Cull the population or otherwise • reduce its growth • - Recognize and keep density above • the critical density • Populations consist of sources ( > 1) • and sinks (<1), the latter doom to extinction…….. • Populations have good years and bad years • and temporal variation is bad …………………………… • Populations can grow chaotically by over- • and under-shooting Carrying capacity…………………. • Populations with an Allee Effect can decline • to extinction if N is too low………………………………..
1dN N dt N 2 Models of growth Exponential – all populations have the capacity to growth exponentially, but N Growth has no limits and is density independent Sustained Exponential growth is unrealistic time 1dN N dt = r
1dN N dt 0 N K K Logistic – recognizes limits to growth (Carrying capacity) and incorporates the negative effect individuals have on their growth rate N (- Density Dependence) time 1 dN N dt r (K-N) = r K Stable EQ @ K
1dN N dt • DD • Individuals inhibit • their growth 0 N K + DD e.g., social behavior safety in numbers One other variation is the ALLEE EFFECT where individuals also have + Density Dependence at low density aahhhhh….
Important Concepts we have touch upon under Population Growth • Life Tables: Understanding how patterns of age-specific survivorship • and maternity has consequences for population growth and can be • manipulated to achieve a management goal • Variability: In space, populations exist as sources ( > 1) and sinks • ( < 1), the latter of which must receive migrants to persist (Rescue Effect) • In time, environmental variation is an anathema to population growth, but • it too has a cure: increase the number of populations, migration, • Intrinsic Variability: Appreciate the difference between external and • internal variation arising from time lags and delayed density dependence. • Its cure is radically different than for external variation – and requires • culling population size or otherwise reducing the growth rate.
Important Concepts we have touch upon under Population Growth • EQ, stability, and Pop. regulation: Attainable only under • (-) density dependence. Negative feedback is Universal • Domains of Attraction: Specifically, under the Allee Effect, • population extinction is an “attractant” below some critical density ------------------------------------------------------------------------ The concept of the limits to growth is manifested in the Carrying Capacity Species Social Behavior is manifested in the Allee Effect But otherwise, we have incorporated the biology of species as phenomena and have not appreciated the actual details But we will……
Grass? 1 dN N dt Lions? (K-N) = r K ??Energy/stress?? Where’s the Biology? Wildebeest populations growth competition for grass occurs Individuals are energy stressed Lions kill off weak individuals
The Phenomenological Approach THEGOOD: Modeling the phenomena allows us to look past the details … we don’t need separate models for every organism THEBAD: We only get a superficial understanding …. when the details matter we’re left scratching our heads This tradeoff between DETAIL and GENERALITY Is pervasive throughout science