Download
1 / 24
240 likes | 584 Vues
This informative guide presents practical steps and advanced techniques to reduce radiation dose in CT scans, helping to prioritize patient safety. Learn how to avoid unnecessary scans, implement targeted CT protocols, adjust mAs and kVp settings, and utilize innovative dose monitoring methods. Stay informed about the latest strategies to minimize radiation exposure while maintaining high-quality imaging results.

E N D
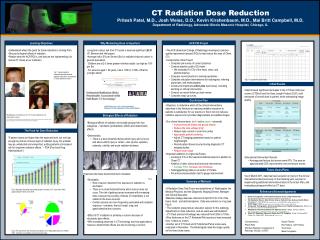
7 Practical Steps for ReducingRadiation Dose in CT Disclosures: None
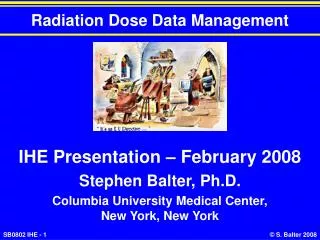
E-POE with Decision Support Ref: Sistrom C L et al. Radiology 2009;251:147-155
2. Avoid z-creep: anatomy • Radiation dose is proportional to total scan length • Targeted CT scans • Indeterminate renal mass w/u: abdomen only • Ref: Prasad et al JCAT 2002 • Kidney stone low-dose protocol: mid-liver • Abd-Pel CT: Average 12 extra slices • Ref: Kalra et al, Radiology 2004
Radiation dose is proportional to total scan length Limit number of phases 1 to 2 phases: 2x dose CT Urography in patients with hematuria: 2 phases Non-CM + combined Nephrographic & Excretory Ref: Chai et al. Australas Radiol. 2001 Nov;45:536-8 I- only if stones seen in patients aged <40 years 2. Avoid z-creep: phases
3. Lower mAs: leverage technology • Decreasing mAs lowers radiation dose Ref: McNitt-Gray; Radiographics 2002 ΔmA: effects noise only Fixed kVp
mA determined from size & density on scanogram Radiologist decides ‘noisy’ vs. ‘smooth’ images Clinical question Soft-tissue contrast Operator selects ‘reference mA’ or ‘noise index’ or.. Scanner picks mA: size and density Use Automatic Current Modulation
Use Automatic Current Modulation • mA modulation in abdominal CT • Radiation dose with a 16-channel MDCT • 54/62 pts:↓ mean 37.9%, but 8/62 pts: ↑ mean 11.6% • Ref: Kalra et al; Radiology Oct 2004 mAs: 93 112 76 170
Low mA CT • Hx: Flank pain; ? Kidney Stone • Noise Index: 20 • Effective Dose: ~1.5 mSv 176 mAs 37.5 mAs Ref: Kalra et al. Radiology 2004 3866330
Lower mA further with IR Algorithms FBP Partial IR Full IR 200 mAs 100 mAs 50 mAs Courtesy: M. Kalra
Lowering mAs with IR c/w Historical: 50% 30% 15%
4. Consider Lowering kVp Decreasing kVp also lowers radiation dose Effect on image quality differs Ref: McNitt-Gray; Radiographics 2002 ΔkVp: effects noise & attenuation ΔmA: effects noise only Fixed kVp Fixed mAs
CT Technique Physics • kVp: 80100120140 • mAs (iso-fluence; 70kg): 1000 430 200 120 • Relative Dose (CTDIw): 1.9 1.6 1.2 1.0 • Refs: Huda, Rad 00; McNitt-Gray, RadioGraph 02; Johnson, et al, Eur Radiology 2006
Low kVp: Pediatric CT • kVp: 80100120140 • mAs (iso-fluence; 70kg): 1000 430 200 120 • 10Kg (=120/200 70Kg): 65 33 17 11 MGH Pediatric Protocols Singh et al, Radiology 2009 Siegel et al. Radiology 2004
Low kVp: CTA • Peak kilo-voltage (kVp): 80100120140 • Iodine attenuation 1.0 0.75 0.60 0.50 • Mean keV 43.7 51.6 56.8 61.5 • K-edge I: 33.2 keV • Low kVp w/o ↑ mAs • High contrast CT Nyman et al. Radiology 2002
Low kVp: Donor CTA • Sahani et al, AJR 2006
5. Technique: indication, age & weight • Pink: routine (95-190) • Green: ↓ f/u benign e.g. abscess (70-140) • Red: ↓↓ bone CT (50-100) • Yellow: kidney stone (95-190) • Blue: ↑subtle lesions (120-240) • Grey: CTA (95-190) Singh et al, Radiology 2009
6. Dose Monitoring • Example: Effective Dose = DLP/100 *1.5 = 24 mSv • Typical body CT DLP 700 mGy.cm or ~10 mSv • Annual Non-medical background radiation: ~3 mSv
7. Understand Risk Deaths: 30,050 vs 30,000 0.16% Increase Ref: Brenner et al, Gasgtroenterology 2005
Right Test Focused Protocols Optimized kVP & mA Technology Indications, age Monitor Dose Understand Risk Culture trumps Strategy 776 60 50 39 40 Mishaps/100,000 Flight Hours 30 20 10 0 50 65 80 96 Year Summary Friday May 2, 2003