Download
1 / 16
160 likes | 291 Vues
Environmental Monitoring in Lithuanian Agriculture Methods, Results and Perspectives. A.S.SILEIKA, K. Gaigalis, A.Smitiene, G.Baigys Lithuanian Institute of Water Management 11.12. 2002. Agro monitoring. Geographical characteristics.

E N D
Environmental Monitoring in Lithuanian AgricultureMethods, Results and Perspectives A.S.SILEIKA, K. Gaigalis, A.Smitiene, G.Baigys Lithuanian Institute of Water Management 11.12. 2002
Geographical characteristics • Lyzena, Graisupis and Vardas watersheds belong to three main physical-geographic zones of Lithuania: Western, Middle and South-Eastern zones • The watersheds differ by their climatic and geographic characteristics, which have determined partially diverse agricultural activity among the zones • Lyzena watershed lies about 100 km from the Baltic Sea and it experiences more marine climate (higher rainfall, smaller difference in temperature around a year) • Graisupis and the Vardas watersheds are further from the sea (170 and 250 km) and affected by more continental
Soil characteristics • Lyzena and Vardas watersheds have hilly relief while the Graisupis catchment is flat • Soil in the catchments is of different texture: from loam in the Lyzena and loam and sandy loam in the Graisupis to loamy sand in Vardas watershed • Soil P content is high in the Graisupis catchment and low and very low in the Lyzena and the Vardas catchments respectively
Agricultural activity • Farms in the Graisupis watershed specialise in crop production for market (grain, sugar beet) as well as in animal husbandry • There is a private farm with more than 100 and agricultural company with 300livestock heads and a 1250-places piggery;animal density is 0,87 LU ha-1. • Arable land occupies 54% in the Graisupis catchment, pastures – only 15%; • In Lyzena and the Vardas watersheds there are only some small private dairy farms (up to 10 cows);animal density is 0,58 and 0,44 AU ha-1 respectively. • Pastures in the Lyzena and the Vardas watersheds occupy twice as much area as arable land. Most of the pastures are not grazed intensively and they have not been ploughed for many years.
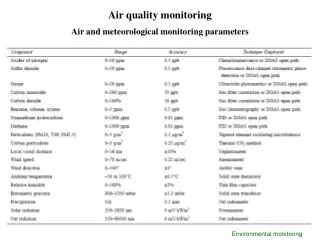
Monitoring methods • Stream water flow and water quality are measured at monitoring stations • Thompson weirs are used for flow measurements. Water level is registered automatically by limnigraphs, and then specific water runoff is calculated. • The river water samples are taken manually every day. Joint weekly samples are analysed in spring and joint monthly sample at another time of the year • Total nitrogen and total phosphorus is determined by methods approved for state monitoring progrmme • The concentration of the nutrients and average monthly values of the river water flow are used for calculation of nutrient losses. According to the annual nutrient load an annual mean flow-weighted concentration is calculated. • Tipping buckets method is used for average monthly nutrient losses in the watersheds to show the variance in N and P among the months.
Nitrogen leaching • Annual mean flow-weighted totN concentration in the Lyzena river ranged between 1.6 and 3.3 mg l-1 (average was 2.4), in the Graisupis river – 6.6-12.7 mg l-1 (8.9), in the Vardas river – 3.4-5.5 mg l-1 (4.6) • Summer and autumn is typical for its lowest nutrients concentration: 1.23 in the Lyzena, 3.97 in the Graisupis and 2.19 mg l-1 in the Vardas on average. • In January-March almost no leaching of nitrogen occur while the soil was frozen and biochemical processes were very slow in the stream
Phosphorus leaching • The highest average annual flow-weighted totP concentration was in Graisupis (56 to 293 g l-1); the lowest was in Lyzena river (30-35 g l-1) and in Vardas river it was 33-104 g l-1 • There were more peaks in totP concentration in the Graisupis river (1080 g l-1 in November 2001, 820 g l-1 in July 1999, 475 g l-1 in August 1996 • The peaks in totP concentration usually occurred when there was very little water in the river (water depth of a few cm); therefore it had very little effect on annual load
Nitrogen losses • The high nutrient losses occur in winter and spring timewhen the concentration and water discharge are usually the highest. • Average annual totN losses were always lowest in the Lyzena watershed: from 4 to 8.5 kg ha-1 (average of 5.7 kg ha-1) • The losses in Graisupis watershed were much bigger: 8.9-22 kg ha-1 (average of 15.3 kg ha-1) • The losses in Vardas watershedvaried from 6.1 to 19 kg ha-1 and the average of 1996-2001 was 11.9 kg ha-1
Phosphorus losses • The highest monthly totP losses were observed in Lyzena watershed: 961 g ha-1 in December 1997 • The highest monthly totP losses in the Graisupis and the Vardas watershed were 562 g ha-1 (November 2001) and 161 g ha-1 (December 1997) respectively • All monthly totP losses above 30 g ha-1 occurred in November-March • P losses in three months when the losses were the highest comprised 75% of total losses in 1997-2001 year in the Lyzena, 67% in the Graisupis and 43% in the Vardas watershed
Conclusions • The biggest N losses (15.3 kg N ha-1) determines more intensive agricultural activity (71.5 kg N ha-1 of fertilisers; 54% of arable land; 0.87 LU ha-1) • Close to the sea the marine climate causes bigger water discharge in winter but due to low N content in soil (32.9 kg N ha-1 of fertilisers, 65% of grassland) the annual N losses are very small (5.7 kg N ha-1) • The highest P losses (0.318 kg P ha-1) determine hilly relief and clay soil • Bigger specific water runoff (0.08 l s-1 ha-1) and light soils (sandy loam) determine comparatively high N losses (11.9 kg N ha-1) despite low farming activity (39.4 kg N ha-1 of fertilisers, 47% of grassland) • Two more monitoring watersheds (in polders area at Curonian lagoon and south Lithuanian plain) are needed to get full picture of nutrient losses from Lithuanian agriculture