Efficient Data Entry for "Do the Math" Intervention in CFS
Learn how to enter intervention data in three simple steps: open, enter data points, and close intervention in CFS. Follow clear instructions for pre-test scores, choosing modules, and progress monitoring. Save time and track student progress effectively.


Efficient Data Entry for "Do the Math" Intervention in CFS
E N D
Presentation Transcript
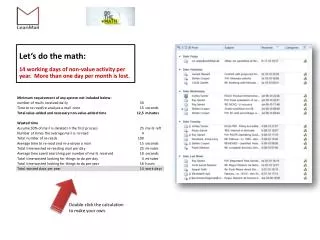
Three main steps (just three!) • Open intervention • Enter three data points (throughout intervention) • Close intervention
I have the module pre-test score, now what? • Add an intervention for each student • MATH… click on ‘Add • Intervention’
For Tier 2 interventions such as Do the Math, ILP not needed; fill in ‘dummy’ data such as ‘*, -, or /’. For Tier 3 interventions, health and vision/hearing screeningnecessary., Don’t forget to click ‘save’!
2.) Choose correct ‘Do the Math’ module from pull-down menu 1.) Choose either problem solving or computation 3.) Start date is first date of intervention 4.) Roughly a month later (at mid-point of intervention) 5.) dependent on resources 6.) dependent on resources 7.) Enter pre-test score, (do not enter % sign) 8.) Goal = 80 9.) Your first name or initial 10.) Your last name Don’t forget to click ‘Save’ at the bottom! 11.) Enter group size
Enter pre-test and assessment scores as progress monitoring data points From the student’s CFS page, click on ‘Add’ at the Math intervention entry, under the PM heading (progress monitoring) Two ways to enter necessary data: From the previous screen, click on ‘Progress Monitor Graph’ in upper right corner
1.) ‘Area Name’ is the name you give the graph ; “Do the Math (and module name)”. You will choose this ‘Graphing Area’ or graph again as you enter other progress monitoring data for this module. 2.) date student took pre-test 3.) anticipated completion of module 4.) score on pre-test (do not enter “%”) leave blank 5.) 80 6.) tick this box leave blank Don’t forget to click ‘save’! Then you’re done with this segment! Leave blank – intervention has not yet started, so there is nothing that has changed.
After 15 lessons, give the post-test as mid-point assessment, enter score In the ‘Graphing Area’, click on ‘Add New’ Or, if on the student’s page, click on the picture of a graph, then you will see the screen above. Click on ‘Add New’ Do the Math (Multiplication A) Math
Enter mid-point assessment (post-test given after 15 lessons) score 1.) choose the graph you started when you entered the pre-test 2.) enter the date the student took the assessment 3.) anticipated date Leave blank 4.) enter student’s score 5.) “80” should show up Leave blank unless change to frequency, duration, etc. Don’t forget to click ‘Save’ at the bottom! Add notes if changes made to intervention frequency, duration, etc.
Student scored 80 or above on mid-point assessment (post-test)? Close intervention… • Click the ‘Help’ tab in CFS, which takes you to KnowledgeBase • Use one of the Quick Reference Guides or tutorials to close the intervention as ‘successful’ • Student scored less than 80 on mid-point assessment? Continue with intervention, enter 3rd (and last) data point, post-test, then close intervention.
All 30 lessons and post-test are complete! Enter post-test score … Enter last data point (post-assessment) by clicking on ‘Add New’ and following the steps in the previous slide Click on ‘Open Graph’ to view the graph
Intervention is done! • Close intervention – use Quick Reference Guides in CFS’s KnowlegeBase • Student data shows evidence requiring another Do the Math module? Open a new intervention for it.