Download
1 / 30
300 likes | 458 Vues
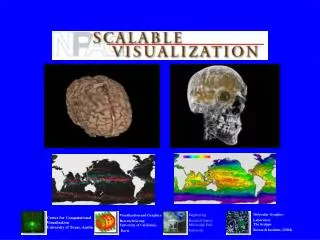
Molecular Graphics Laboratory The Scripps Research Institute (TSRI). Engineering Research Center Mississippi State University. Visualization and Graphics Research Group University of California, Davis. Center for Computational Visualization University of Texas, Austin. Motivation.

E N D
Molecular Graphics LaboratoryThe Scripps Research Institute (TSRI) Engineering Research CenterMississippi State University Visualization and Graphics Research GroupUniversity of California, Davis Center for Computational Visualization University of Texas, Austin
Motivation • Enable existing resources • Handle large data • Support distributed environments • Multi-discipline
Motivation: Large Data • There will always be large data • Even though graphics hardware improves • Numerical simulation resources are increasing • Instrument fidelity is increasing • Volumes and time series lead to large data • Recent Example: • Orion nebula for AMNH ~2.5TB • Emission Nebula for AMNH ~6TB • ENZO 1024^3 Cosmology Simulation ~12TB
Layered Toolkit Architecture Application Expression Tree Toolkit Mesh Toolkit Data Grid Toolkit Data Management File Format Handling SRB, ADR, etc.
Mesh • Manage a pagedmesh (array-like) • An N-dimensional grid of values • Spatial data & time-series • Arbitrary data content • Multiple file formats • Layered atop local I/O and SRB
Application Expression Tree Toolkit Mesh Toolkit Data Grid Toolkit Data Management File Format Handling SRB, ADR, etc. Data Grid Toolkit Managing Data Grids • Manage a paged data grid (array-like) • An N-dimensional grid of cells • Spatial data & time-series • Arbitrary cell data content • Handle larger-than-core data • Transparently pages data in/out • Support from ADR & DataCutter • Compressed data (disk & memory)
Application Expression Tree Toolkit Mesh Toolkit Data Grid Toolkit Data Management File Format Handling SRB, ADR, etc. Data Grid Toolkit Pre-fetching Intelligently 5 3 9 1 7 8 6 4 2 • Random access (slow) • Get/set cells in any order • Structured access (faster) • Get/set cells in a pre-defined order • Data-order access (fastest) • Get/set cells in the data’s storage order 1 2 3 4 5 6 7 8 9 1 2 3 4 5 6 7 8 9
Application Expression Tree Toolkit Mesh Toolkit Data Grid Toolkit Data Management File Format Handling SRB, ADR, etc. Data Grid Toolkit Paging Intelligently • Neighborhood-aware paging • Page in nearby cells in N dimensions • Support convolution filtering, rendering, marching-cubes, ... Filter window Current center cell 0 1 2 3 4 5 6 7 8 9 10 11 12 13 14 15 16 17 18 19 20 21 22 23 24 Keep neighboring cells paged-in as well
Application Expression Tree Toolkit Mesh Toolkit Data Grid Toolkit Data Management File Format Handling SRB,ADR, etc. Mesh Toolkit Using Coordinate Systems • Bind a coordinate system to a data grid • Euclidean, cylindrical, spherical, time-series, ... • Uniform, structured, unstructured • Handle coordinate system-based operations • Resampling with interpolation • Lazy-evaluation • Multiple file format handlers
VISTA Layer • Volume rendering layer • Modular feature set • Specializing in large high resolution out of core rendering
Applications VISTA Mesh Paged Array SRB & Local I/O VISTA Layer • Builds on mesh layer • I/O transparent • File formats transparent • Paging • Applications & Services layered on top • CORBA render server • Batch renderer • Interactive tools
VISTA: Features • Perspective ray casting • Multiple volume support • Scalar data support using transfer functions • Color data, with opacity, or opacity and emissivity • Modular: other algorithms,renderers
VISTA Rendering Server • Built on VISTA toolkit • Multiple versions for interoperability: Sockets, CORBA, Grid CORBA Interactive Graphics Clients Remote VISTA Server Sockets
Renderer & Server • Built on VISTA toolkit • Command line arguments for batch rendering • Uses CORBA for communication and interoperability
Mesh Viewer • Interactive multi-mesh viewer • Built atop Mesh & VISTA Toolkits • Uses standard 3D graphics hardware • Single and multiple volume viewing Interactive Rendered
Mesh Viewer • Point clouds • Built on mesh toolkit • Local Renderer • Java ray caster from VISTAtoolkit • Remote renderer • Render server from VISTAtoolkit Interactive Rendered
VGrid Portal Visualization Services Grid Grid Farm SRB Archive VGrid Gallery SVT Grid Services Workstation Alley
Future Plans • Personalized Pages • Personalized Templates • Improved Job Submission Pages • Automated Web Gallery Generation • Improve Archive to SRB integration. • External SRB links in Archive • Remote file transfer • Support for DAKS Matrix • Support for APST users
Cancer Center Visualization Images Animations Movies Visualization Expertise UCSD Cancer Center Software Development Research Intern Computational Scientists Medical Expertise Visualization Tools 1 Research Scientist Supercomputers Latest Microscopy Tools Shared Staff Cancer Research Scientists SDSC Cancer Expertise
Sample Visualizations Universe Simulations UCSD Cancer Center
Astronomical Visualization Visualization of An Emission Nebulae from 3 Terabytes of Simulation Data Credits: American Museum of Natural History Dave Nadeau SDSC Erik Engquist SDSC
Alpha Project Partners Center for Computational Visualization (CCV)University of Texas, Austin Visualization and Interactive Systems (VIS) GroupUniversity of California, Irvine • Molecular Graphics LaboratoryThe Scripps Research Institute (TSRI) Scientific Visualization GroupSan Diego Supercomputer Center (SDSC)University of California, San Diego (UCSD) Visualization and Graphics Research GroupUniversity of California, Davis
Web Sites • http://visservices.npaci.edu • http://vistools.npaci.edu • http://vis.sdsc.edu