Download
1 / 62
790 likes | 1.16k Vues
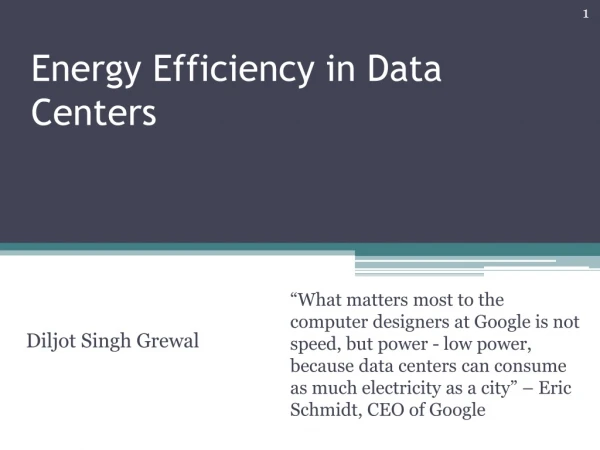
Energy Efficiency in Data Centers. “What matters most to the computer designers at Google is not speed, but power - low power, because data centers can consume as much electricity as a city ” – Eric Schmidt, CEO of Google. Diljot Singh Grewal. Some Facts.

E N D
Energy Efficiency in Data Centers “What matters most to the computer designers at Google is not speed, but power - low power, because data centers can consume as much electricity as a city” – Eric Schmidt, CEO of Google Diljot Singh Grewal
Some Facts • Data centers consumed 235 billion KWH of energy 2 worldwide(2010). • Datacenters consumed 1.3% of total electricity consumption of the world(as on august 2011) • In 2000 DC used 0.53% , which almost doubled to 0.97% in 2005, by 2010 it rose only to 1.3% • A rack drawing 20 KWH at 10cents per KWH uses more than 17000$ in electricity.
Energy Efficiency • Run a DC wide workload and measure energy consumed
Power Usage Effectiveness (PUE) • In 2006, 85 % of DC had PUE of greater than 3.0. 5 • Another study estimated it at 2.0 6 • In the state of Art Facility the PUE of 1.1 is achievable.7
Reasons: • Staged Deployment • Fragmentation • Following Nameplate Ratings • Variable Load • Excessive/Inefficient Cooling • Excessive/ Inefficient humidity controls…
115kV to 13.2kV Loss ~0.5% 6-12% loss Chillers consume 30 – 50% of IT Load. Loss in Wires ~1-3% CRAC units consume 10-30% of IT Load
Improving Infrastructure • Increasing Temperature to 27 ◦C from 20◦C. • Isolate hot exhaust air from intake • Using High Efficiency UPS and other gear • Google Achieved a PUE of 1.1 by 9 • Better air flow and Exhaust handling. • Temperature of Cold Aisle at 27 ◦ C • Cooling Tower uses Water evaporation • Per server UPS that has Efficiency of 99.99% instead of facility wide UPS
Humidity Control • Condensation on Cooling coils can reduce the humidity • Low (<40% rH) humidity levels can lead to static buildup (sparks that can damage chips). • Steam Humidifiers are Energy Expensive • Energy Savings?? • Using evaporative cooling on incoming air . • Using evaporative cooling to humidify the hot output air and cool it( which is then used to cool the incoming air)
SPUE • Losses due to power supplies, fans, voltage regulators • 𝑇𝑜𝑡𝑎𝑙 𝑃𝑈𝐸=𝑃𝑈𝐸∗𝑆𝑃𝑈𝐸 • If both stand at 1.2 then only 70% of the energy is actually used for computation.
Efficiency of Computing • Hardest to measure. How Do we Benchmark? • New benchmarks : Joule-sort and SPEC power • No benchmarks for Memory or Switches
CPU • Uses up to 50% at peak but drops to 30% at low activity • Dynamic Ranges • CPU 3.5x • Memory : 2x • Disks 1.3x • Switches 1.2x
Energy Proportional Computing. • Low Idle Power and proportional afterwards • energy spent will be halved by energy proportionality alone if the system idles at 10%.11 • Might be fine if peak is not that good
10 Load level(%) of peak
Dynamic Voltage and Frequency Scaling • The time to wake up from low voltage state depends on voltage differential • Not useful on Multicore Architectures?
The CPU States • ACPI States: • Power management component of kernel sends a signal to the Processor Driver to switch to a state • States: • C0 Normal Operation • C1 ,C2: Stops Clocks • C3 : C2+ reduced Voltage • C4 : C3 + Turns off memory Cache
The Multicore problem • Clock Gating • Core level Clock gating • Voltage Gating? • Voltage depends on core with high utilization • Lower Wake Up Penalty by using the Cache • New architectures have penalties of 60µs down from 250µs. • Power Gating (Power Control Unit) • Separate Power planes for Core and Un-core part
Software’s Role • Well Tuned Code can reduce the consumption. • Code that generates excessive interrupts or snoop requests is not good. • OS Power Manager speculates the future processing requirements to make a decision according to the settings selected by user.
Lets talk Storage • Consumes about 27% power • High Performance Disks to match the µP Speed • According to IDC report in 2008, total cost to power and cool a drive is 48 watts. 13 • 12 watts for running HDD • 12 watts for storage shelf (HBAs, fans, power supply) • 24 watts to cool the HDDs and storage shelf
Electronics & Software • Adaptive Voltage • Frequency Reduction in Low Power Modes • Queuing Algorithms to minimize rotational delays • Algorithm to manage transitions between low and high power modes
Mechanical • Lighter Materials • Better motor Design • Using Helium in a sealed case to reduce air drag • WD claims energy savings of 23% with higher capacity(40%) • Load/Unload
Tiered System 14 • Manage workloads efficiently among multiple RPMs in a storage system • Tiered storage • Tier 0 with solid state drives (5%), • Tier 1 with high performance HDDs (15%) • Tier 2 with low power HDDs (80%)
Mixed Approach • Mirror HP Disk on Low Power Disk and use the low power disk under light load.14 • The Low performance disks use significantly low energy than HP Disks. • Other approaches • Multispeed Disks: ability to change spin speed.14 • Lower Rotational speed but multiple heads
Solid State Disks • require up to 90% less power 15 • offer up to a 100 times higher performance 15 • Life span of the SSD depends on the I/O ops and it is not good enough for server yet. • MLC vs. SLC
File system problems? • Google File system: • Distribute data chunks across large number of systems (entire cluster) for resiliency.. • But that means all machines run at low activity and do not go idle.
Memory • SRAM: Requires constant voltage • DRAM : Since capacitors leak charge, we need to refresh them every 64 ms (JEDEC) • Suppose we have 213 rows, then we need to refresh a row every 7.8µs.
Alternatives • Low Voltage RAM (LoVo) • Runs at 1.25V (DDR2-1.8V and DDR3 - 1.5V) • 2-3W per RAM(2GB) • SSD as RAM17 • Future: • Ferroelectric RAM • Magnetoresistive RAM (MRAM)
Is Performance Per Watt all we need? Are few ‘Bulls’ better than a flock of ‘Chickens’? • If it is, then we should Buy ARM Servers. • Smaller RAM and Laptop HDD’s • 20 times lower power but at 5 times lower performance : High Response times. • Acc. to Google’s Study, The users prefer 10 results in 0.4 sec over 25 in 0.9 sec.
Power Provisioning Costs • Building a Datacenter that can provide power to servers can be costlier than Electricity costs. • $10-22 per deployed IT Watt(provisioning cost) • Cost of 1 Watt of IT Power = • (per year per watt) • Cost savings from efficiency can save more in provisioning.