Download
1 / 45
450 likes | 600 Vues
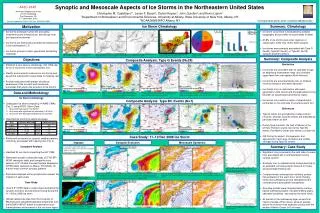
Organization and Atmospheric Conditions of Flash Floods in the Northeastern United States. Stephen M. Jessup Dept. of Earth and Atmospheric Sciences Cornell University. Research Question.

E N D
Organization and Atmospheric Conditions of Flash Floods in the Northeastern United States Stephen M. Jessup Dept. of Earth and Atmospheric Sciences Cornell University
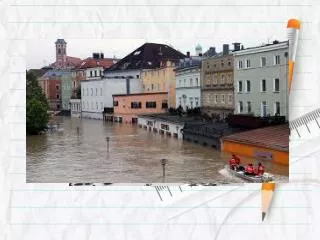
Research Question Are flash-flood-producing precipitation events in the northeastern U.S. different from those in other regions of the country?
Other Regions N = 168 Northeast N = 16 Schumacher and Johnson, 2006 (SJ2006)
Methodology Select events: UseStorm Data reports to select a pool of events and use precipitation amounts to select the Storm Data report from each event day to include. Estimate precipitation: ConvertNEXRAD radar data to basin-averaged rainfall estimates using AMBER (the same real-time basin-averaged rainfall accumulation estimation algorithm used by the NWS). Classify events: Expand upon the classification system of Schumacher and Johnson (2006). Describe environmental conditions: Generatecomposite maps from the North American Regional Analysis.
Overview • Motivation • Research Question • Methodology • Event classification • Precipitation Estimates • Atmospheric Conditions • Summary
Flash Floods, Northeast, This Study Events meeting SJ2006 Threshold (N = 23) All Events (N=187) Extreme Precipitation Events, SJ2006 Other Regions (N = 168) Northeast (N=13)
Linear Events Synoptic Events Other Events Back-building Events Multiple Events
Linear Events Scalar Events Back-building Events Scattered Events
Linear Events TLAS Parker and Johnson, 2000 SJ2006
Scale Events Synoptic SYN Large Mesoscale LM 24 hr 150 km Medium Mesoscale MM 50 km Small Mesoscale - Isolated SMISO
Back-building Events Merging Back-building BBMERGE t0 t0+Δt Back-building Followed by Linear Features (BBMULT1) Linear Features Followed by Back-building (BBMULT2) t0 t0 t0+Δt t0+Δt
Scattered Events Scattered Precipitation Training SCTTR ScatteredPrecipitation “Random” Motion SCTRAND Scattered Precipitation Merging Features SCTMERGE Scattered Precipitation Small Mesoscale SCTSM
Overview • Motivation • Research Question • Methodology • Event classification • Precipitation Estimates • Atmospheric Conditions • Summary
Precipitation Analysis Do certain types of organization tend to produce significantly more (or less) precipitation?
Precipitation Analysis Do certain types of organization tend to produce more precipitation during certain times of day or certain times of year?
Overview • Motivation • Research Question • Methodology • Event classification • Precipitation Estimates • Atmospheric Conditions • Summary
Environmental Propertiesof Storm Types Are there detectable differences in the synoptic and mesoscale environments of different types of events?
SYN LM MM SMISO
Back-building Events BB BBMERGE BBMULT1 BBMULT2
Scattered Events SCTTR SCTRAND SCTMERGE SMSCT
Overview • Motivation • Research Question • Methodology • A look at flash flood reports • Event classification • Precipitation Estimates • Atmospheric Conditions • Summary
Which types of events produce the most rainfall the most often?
TS PS SYN LM LS TLAS MM SMISO BB BBMERGE SCTTR SCTRAND SCTSM BBMULT1 BBMULT2 SCTMERGE
TS PS SYN LM >150 km >150 km >24 hr <24 hr LS TLAS MM SMISO 50-150 km <50 km BB BBMERGE SCTTR SCTRAND BB BB BBMULT1 BBMULT2 SCTMERGE SCTSM BB BB
TS PS SYN LM >150 km >150 km >24 hr <24 hr LS TLAS MM SMISO 50-100 km <50 km BB BBMERGE SCTTR SCTRAND BBMULT1 BBMULT2 SCTMERGE SCTSM
TS PS SYN LM >150 km >150 km >24 hr <24 hr LS TLAS MM SMISO 50-100 km <50 km BB BBMERGE SCTTR SCTRAND BBMULT1 BBMULT2 SCTMERGE SCTSM
Which types of events occur in the most “favorable” environments? • Dynamics
TS PS SYN LM LS TLAS MM SMISO BB BBMERGE SCTTR SCTRAND BBMULT1 BBMULT2 SCTMERGE SCTSM
Which types of events occur in the most “favorable” environments? • Dynamics • Slow winds
TS PS SYN LM LS TLAS MM SMISO BB BBMERGE SCTTR SCTRAND BBMULT1 BBMULT2 SCTMERGE SCTSM
Which types of events occur in the most “favorable” environments? • Dynamics • Slow winds • High moisture
TS PS SYN LM LS TLAS MM SMISO BB BBMERGE SCTTR SCTRAND BBMULT1 BBMULT2 SCTMERGE SCTSM
How do high precipitation events differ from low precipitation events? • Dynamics - red • Low-level Winds - yellow • Mid-level Moisture – blue • Small sample size – black • No difference - white
TS PS SYN LM LS TLAS MM SMISO BB BBMERGE SCTTR SCTRAND BBMULT1 BBMULT2 SCTMERGE SCTSM
Are flash-flood-producing precipitation events in the northeastern U.S. different from those in other regions of the country? Yes… They appear to be more disorganized.
Are flash-flood-producing precipitation events in the northeastern U.S. different from those in other regions of the country? No… They still get the job done.
Future Work • Frequency of storm types in other regions • Objective analysis of storm types via computer algorithm • Characteristics of flash floods that produce fatalities and significant damage • Computer modeling of BBMERGE, SCTRAND, and SCTMERGE events • Linking precipitation organization and hydrology • Role of antecedent moisture • How does storm type relate to the spatial characteristics of watershed response?
Acknowledgments This work is supported by NSF grant EAR 0911076. Special thanks to my Ph.D. advisor, Steve Colucci Many thanks to many friends and colleagues. Thank you!
Why is a taxonomy of warm season rainfall important? • Provides a research framework for anticipating and observing rainfall organization • Some types of organization produce more rainfall, or produce more widespread heavy rainfall than others. • While, especially in the central U.S., MCSs are important heavy rain makers, more disorganized (or larger and more uniform) rainfall can also produce significant flash flooding, especially, it seems, in the northeast U.S. • The spatial properties of precipitation undoubtedly play a role in dictating the hydrologic response . • Provides another layer of flash flood forecaster awareness • Anticipation of rainfall organization based on atmospheric conditions. • Real-time radar recognition of rainfall organization and related flood potential.