Download
1 / 4
40 likes | 258 Vues
The Wonderful World of Graphs. Graphs are measuring systems designed to show relationships . They are very useful in providing information in world geography. For now we will utilize three types: line , bar , and circle . .

E N D
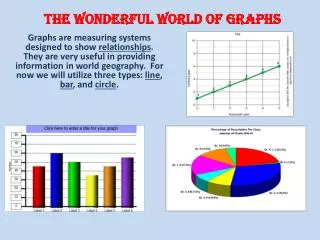
The Wonderful World of Graphs Graphs are measuring systems designed to show relationships. They are very useful in providing information in world geography. For now we will utilize three types: line, bar, and circle.
Linegraphs show changes in one variable, or a changing set of circumstances.
Bargraphs show comparisons between two or more variables. The bars can be arranged vertically or horizontally.
Circle graphs show how individual parts compare to the whole. The whole, of course, is 100 percent.