BellRinger
110 likes | 130 Vues
Learn about the different types of graphs used by scientists to visually display and analyze numerical data, including bar graphs, pie graphs, line graphs, and scatter plots.

BellRinger
E N D
Presentation Transcript
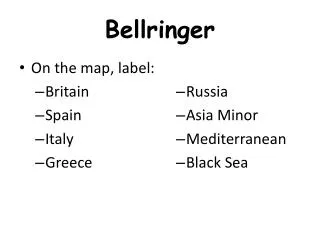
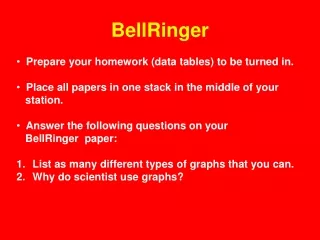
BellRinger • Prepare your homework (data tables) to be turned in. • Place all papers in one stack in the middle of your • station. • Answer the following questions on your • BellRinger paper: • List as many different types of graphs that you can. • Why do scientist use graphs?
Graphs • Visual display or picture of numerical data • Commonly used graphs- bar, pie graphs, and line graphs. • Other graphs - scatter plots,-- pictographs, box and whisker plots, etc. • Useful for recording • and communicating • data • Useful for evaluating • or analyzing data • Shows trends, patterns, • relationships, and • comparisons in data
Bar Graph • Used to represent and compare • data between groups • Show changes over time (trends in • the data) • Good for plotting data that spans • many years • May be simple bar graphs, double • bar graphs, composite bar • graphs, histograms, horizontal bar • graphs, etc.
Pie Graphs • Also called pie charts or circle graphs • Used to compare parts of a whole • Show data as percentages
Line Graph • Used to show trends over • short and long periods of • time • Good for plotting data that • has peaks (ups) and valleys • (downs) • Can be used to display • multiple sets of data at once • (multiple line graphs)
Scatter Plots • Also called scatter graphs and X-Y plots • Show correlations (relationships) or associations • between variables • Used to see if one event affects another event
Let’s Review! #1 A group of students determined the percentage of electricity derived from various energy resources for two different regions. Their data is shown in the table above. – Which type of graph is MOST suitable for displaying this data?– Explain why.
#2 Students grow two groups of plants. Ten plants are given fertilizer, and 10 plants are grown without fertilizer. They measure the height of each plant every other day and find the average height for each group. The table below shows their data. The students want to make a graph of this data to learn about the effect of fertilizer on plant growth.Explain which type of graph the students should make. 70 140 130 120 50 40 60 10 9 8 7 6 5 30 180 20 90 160 150 170 100 110
A double line graph is best for this data because the students are working with two groups of plants and want to show how each group changes over time.