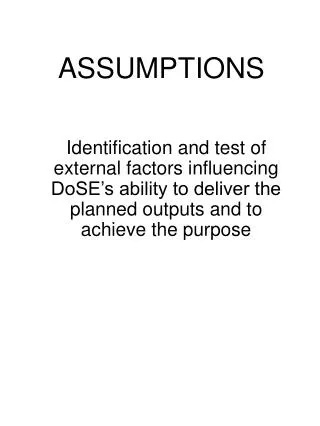
Inventory Cost Flow Assumptions
Inventory Cost Flow Assumptions. During March, Jeremy’s Friendly Market showed the following results: Beginning inventory of Big Q Beans was 400 cans at $0.75 per can

Inventory Cost Flow Assumptions
E N D
Presentation Transcript
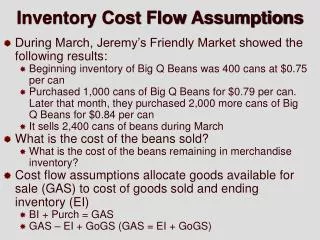
Inventory Cost Flow Assumptions • During March, Jeremy’s Friendly Market showed the following results: • Beginning inventory of Big Q Beans was 400 cans at $0.75 per can • Purchased 1,000 cans of Big Q Beans for $0.79 per can. Later that month, they purchased 2,000 more cans of Big Q Beans for $0.84 per can • It sells 2,400 cans of beans during March • What is the cost of the beans sold? • What is the cost of the beans remaining in merchandise inventory? • Cost flow assumptions allocate goods available for sale (GAS) to cost of goods sold and ending inventory (EI) • BI + Purch = GAS • GAS – EI + GoGS (GAS = EI + GoGS)
Alternate inventory cost flow assumptions • Specific identification • tracks the actual cost of each item in merchandise inventory and the actual cost of items sold • Weighted average • Same cost is assigned to all GAS for each inventory item carried by the business. • Average cost per unit in GAS: Total cost of inventory item _ Total # of units of inventory item • First-in, first-out (FIFO) • Assumes that FIRST items purchased are first items sold • Oldest costs are in CoGS • Most recent costs are in EI • Last-in, last-out (LIFO) • Assumes that LAST items purchased are first items sold • Most recent costs are in CoGS • Oldest costs are in EI
Effect of Cost Flow Assumptions on Financial Statements FIFO LIFO Wt. Avg. Sales $ 3,000 $ 3,000 $3,000 Cost of G. S. 1,930 1,996 1,955 Gross Margin 1,070 1,004 1,045 Oper. exp. 250 250 250 Pretax Inc. 820 754 795 Taxes (30%) 246 226 239 Net Income $574 $528 $556 Assumes sales price $1.25/can & op exp $250
Effect of Cost Flow Assumptions on Financial Statements • Effect of reported inventory and CoGS under different cost flow assumptions • GAS = CoGS + EI • Income tax effects under LIFO and FIFO • Sales revenue and operating expenses - same • Choosing an inventory cost flow method • Similar companies • Maximize tax savings and cash flows • Maximize net income • If LIFO is used for tax purposes, it must also be used for financial statement purposes
Lower-of-cost-or-market Rule • If market value is lower than cost • Reduce the inventory account • Reduce net income • Inventory turnover • Measures how quickly a firm is selling its inventory Cost of goods sold Average inventory • Average inventory = (BI + EI) / 2 • Average days in inventory • 365 (days in year) / Inventory turnover
Business Risk, Control, and Ethics • Inventory padding • Safeguarding assets • Physical controls • Includes ensuring that products don’t spoil • RFID tags • Controlling inventory levels and monitoring product developments to prevent inventory obsolescence
ASSIGN 11 - pg. 304-305, E6-2A, E6-3A, E6-8A ASSIGN 12 - pg. 309-312, P6-1A, P6-7A