Download
1 / 92
930 likes | 1.15k Vues
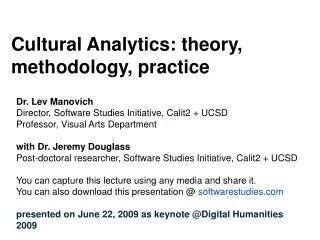
Dr. Lev Manovich Director, Software Studies Initiative, Calit2 + UCSD Professor, Visual Arts Department with Dr. Jeremy Douglass Post-doctoral researcher, Software Studies Initiative, Calit2 + UCSD You can capture this lecture using any media and share it.

E N D
Dr. Lev ManovichDirector, Software Studies Initiative, Calit2 + UCSD Professor, Visual Arts Departmentwith Dr. Jeremy DouglassPost-doctoral researcher, Software Studies Initiative, Calit2 + UCSD You can capture this lecture using any media and share it. You can also download this presentation @ softwarestudies.com presented on June 22, 2009 as keynote @Digital Humanities 2009 Cultural Analytics: theory, methodology, practice
PRESENTATION CONTENTS: analysis and visualization of large cultural data:- theoretical implications- interfaces / visualization techniques- methods for analysis of visual media and born-digital culture
Our research is made possible by the support from:NEH Office of Digital HumanitiesSingapore Ministry of EducationCalifornia Institute for Telecommunication and Information (Calit2), UCSD DivisionCenter for Research in Computing and the Arts (CRCA)UCSD Visual Arts DepartmentUCDARnetUCHRI
Software Studies Initiative Researchers:Lev Manovich | DirectorNoah Wardrip-Fruin | Associate DirectorJeremy Douglass | Postdoctoral ResearcherCicero Silva | Software Studies BrazilWilliam Huber | Researcher | PhD student, UCSDChanda Carey | Researcher | PhD student, UCSDDaniel Rehn | Researcher | MFA student, UCSD
Software Studies Initiative Collaborators:Yuri Tsivian, Department of Art History, University of Chicago: cinemetrics.lv | film analysisAdele Eisenstein: Digital Formalism project (Department for Theatre, Film and Media Studies (TFM), Vienna University; the Austrian Film Museum; Interactive Media Systems Group, Vienna University of Technology) | film analysisIsabel Galhano Rodrigues, University of Porto, Portugal | gesture analysisDavid Kirsh, Cognitive Science, UCSD | dance video analysisJim Hollan, Cognitive Science, UCSD | visualization | cultural analytics softwareFalko Kuester, Structural Engineering, UCSD + Calit2 | visualization | cultural analytics softwareYoav Freund, Computer Science and Engineering, UCSD | machine vision | cultural analytics softwareKay O’Halloran, Multimodal Analysis Lab, National University of Singapore | Mapping Asian Cultures projectGiorgos Cheliotis: Communication and New Media, National University of Singapore | Mapping Asian Cultures projectMatthew Fuller: Goldsmiths College, University of London | software studiesBenjamin H. Bratton: Visual Arts, UCSD + Calit2 | software studies
The joint availability of large cultural data sets (the exponential growth of user generated content, digitization efforts by museums and libraries, digital traces and self-presentation ), cultural information (web presence of all professional cultural agents), the tools already employed in the sciences to analyze and visualize big data, and the techniques developed in new media art makes feasible new methodologies for the study, teaching and presentation of cultural processes and artifacts - including contemporary cultural production, sharing and consumption.
fMRI of a global “cultural brain”today neuroscience combines single neuron recordings, tracking activities of neural networks (1mm) and neural maps (1cm), fMRI of the neural activity of the whole brain, and other methods.Traditional analysis of culture can be compared to recording and analyzing activity of a single cell or a small cell population.We need to start tracking, analyzing and visualizing larger cultural structures - (including their connectivity and dynamics over space and time) - equivalents of neural networks, maps, cortical columns, and the whole brain.Applying other techniques from neuroscience such as staining cells. Applying the basic method of contemporary neuroscience: combining results from different research methods which measure cultural processes at diff. resolutions (MRI, PET, staining cells, genomics, etc.)
new scale:1. digitization of existing cultural assets 2. web presence 3. social media 4. cultural globalization
The rapid growth of professional educational and cultural institutions in many newly globalized countries along with the instant availability of cultural news over the web, the availability of software tools, and cheap travel has also dramatically increased the number of "culture professionals" who participate in global cultural production and discussions. Hundreds of thousands of students, artists, designers have now access to the same ideas, information and tools. In many cases, it is no longer possible to talk about centers and provinces. The students, culture professionals, and governments in newly globalized countries are often more ready to embrace latest ideas than their equivalents in "old centers" of world culture.
growth of a global culture space after 1990. Example: Fashion Weeks, 2005.
growth of a global culture space after 1990. Example: cumulative number of new art biennales, 1895-2008.
world heat map made up from 35 million Flickr geo-coded photos). http://www.cs.cornell.edu/~crandall/photomap/
NEW SCIENCE OF CULTURE?Until now, the study of human beings/cultural processes relied on two types of data: shallow data about many people/objects (statistics, sociology) or deep data about a few people/objects (psychology, psychoanalysis, ethnography, “thick description,” humanities).The development of high performance computing, mobile devices, web and social media allows for a fundamentally new methodology for the study of human beings and society:We can now collect detailed data about very large numbers of people/objects/cultural processes. We no longer have to choose between size and depth. (Example: reality mining project at MIT; Citysense; Blogpulse.) Software, hardware, and networks people use can capture detailed data about some dimensions of peoples’ cultural behavior, imagination and thinking (creating, remixing, reusing, communicating, etc.)
Why “Cultural Analytics”?existing terms:knowledge discoveryfrom data to knowledgeGoogle Analyticsweb analyticsbusiness analyticsvisual analytics = “the science of analytical reasoning facilitated by interactive visual interfaces”
Our goals:- being able to better represent the complexity, diversity, variability, and uniqueness of cultural processes and artifacts than the current cultural technologies allow for- democratize cultural research by creating sets of open-source tools for cultural analysis and visualization (in particular, study of visual and interactive media)- develop techniques to describe the dimensions of cultural artifacts and cultural processes which until now received little or no attention- create much more inclusive cultural histories and analysis - ideally taking into account all available cultural objects created in particular cultural area or time period (“art history without names”)- create representations and interfaces for visual exploration which operate across multiple scales - from details of structure of a particular individual cultural artifact/processes to massive cultural data sets/flows
Platform for Cultural Analytics research environment: HIperSpace (287 megapixels).
What kind of interface do we need to create “situational awareness” for “cultural analysts”? The interfaces used today whenever a person/group monitors a performance of system/machine/process, makes decisions and controls (i.e., a “human-machine system) all share the common principle: - multiple displays which present information about a system/process using diff. visual techniques. Examples: vehicle interfaces, patient monitoring in a hospital, control room of a plant, information dashboards, financial news.*Culture is a complex system / process / environment - therefore we should use similar interface design for studying and monitoring it.
Text Example of an existing interface: Barco’s iCommand
Example of an existing interface: AT&T control center (2001).
Cultural Analytics research environment: interface mockup. Focus: geo map.
IDEOLOGY OF DIGITAL TRACES. Not all cultural and social activities leave digital traces on the web. A significant part of today’s global culture is “digitally invisible.” Therefore, we can’t only do projects which rely on web data or existing databases - we also need to take on “digitally invisible” cultural activities using available and original etnographic research. Example: envisioned analysis of the development of “shanty towns” in Mexico city (using research of the local architects working with these communities.)
Cultural Analytics research environment: interface mockup. Focus: long tail.
Example of long tail visualization: looks on lookbook.nu (sorted by number of hypes). Created by softwarestudies.com
Example of long tail visualization: looks’ titles on lookbook.nu (sorted by number of hypes). Created by softwarestudies.com.
Close-up of visualization of looks’ titles on lookbook.nu (sorted by number of hypes). Created by softwarestudies.com.
Cultural Analytics research environment: interface mockup. Focus: relationships map.
Cultural Analytics research environment: interface mockup running on HIPerWall
Cultural Analytics research environment: interface mockup running on HIPerWall
INTERFACES which combine media browsing and visualization to enable visual exploration of data “The aim pursued with visual exploration is to give an overview of the data and to allow users to interactively browse through different portions of the data. In this scenario users have no or only vague hypotheses about the data; their aim is to find some. In this sense, visual exploration can be understood as an undirected search for relevant information within the data. To support users in the search process, a high degree of interactivity must be a key feature of visual exploration techniques.”Christian Tominski, Event-Based Visualization for User-Centered Visual Analysis, PhD Thesis, Institute for Computer Science, Department of Computer Science and Electrical Engineering, University of Rostock, 2006.“Exploration denotes an undirected search for interesting features in a data set.”Kreuseler, M., Nocke, T., and Schumann, H. A History Mechanism for Visual Data Mining. In Proceedings of the IEEE Symposium on information Visualization (infovis'04) - Volume 00 (October 10 - 12, 2004). INFOVIS. IEEE Computer Society, Washington, DC, 49-56. 2004.source: www.infovis-wiki.net.
Cultural Analytics software running on HIPerSpace (May 2009)
Cultural Analytics software running on HIPerSpace (May 2009)
Cultural Analytics software running on HIPerSpace (May 2009)
VISUALIZATION of a structure of a cultural artifact (borrowing and extending techniques from new media art and “artistic visualization”)
Visualization of complete text of Hamlet. Source: project Guthenberg.
Visualization of complete text of Hamlet. Lines of text are rendered as solid rectangles.
Visualization of complete text of Hamlet. Hamlet = red, King = black.
Representation of video structure: Betty Boop cartoon (left) vs. music videos (center and right)