Understanding Ice Volume and Greenhouse Gas Relationships in Climate Records
370 likes | 537 Vues
This study explores the intricate relationships between sea level changes, ice volume fluctuations, and greenhouse gas concentrations found in ice core records. It discusses how shifts in δ18O of benthic foraminifers correlate with prominent sea level high stands and outlines methods for accurately dating marine sediments through orbital tuning. The age differences in trapped gases versus surrounding ice are examined, raising important questions about climate reliability. It also highlights the significant interplay between greenhouse gases like CO2 and CH4 and historical climate patterns, particularly during glacial and interglacial periods.

Understanding Ice Volume and Greenhouse Gas Relationships in Climate Records
E N D
Presentation Transcript
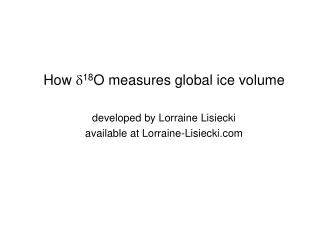
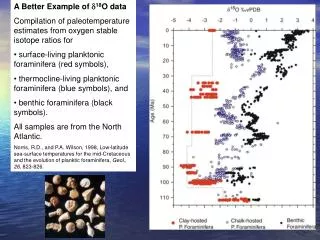
d18O records Ice Volume • Every 10-m change in sea level produces an ~0.1‰ change in d18O of benthic foraminifer • The age of most prominent d18O minima • Correspond with ages of most prominent reef recording sea level high stands • Absolute sea levels estimates from reefs • Correspond to shifts in d18O • Reef sea level record agreement with assumption of orbital forcing • 125K, 104K and 82K events forced by precession
Astronomical d18O as a Chronometer • Relationship between orbital forcing and d18O so strong • d18O values can orbitally tune sediment age • Constant relationship in time between insolation and ice volume • Constant lag between insolation change and ice volume change • Date climate records in ocean sediments • In relation to the known timing of orbital changes
Orbital Tuning • 41,000 and 23,000 year cycles from astronomically dated insolation curves • Provide tuning targets • Similar cycles embedded in the d18O ice volume curves are matched and dated • Now most accurate way to date marine sediments
Orbital-Scale Change in CH4 & CO2 • Important climate records from last 400 kya • Direct sampling of greenhouse gases in ice • Critical questions must be addressed • Before scale of variability in records determined • Reliability of age dating of ice core? • Mechanisms and timing of gas trapping? • Accuracy of the record? • How well gases can be measured? • How well do they represent atmospheric compositions and concentrations?
Vostok Climate Records • Illustrates strong correlation between paleotemperature and the concentration of atmospheric greenhouse gases • Concentrations of CO2 and CH4 moved in tandem with paleotemperatures derived from stable isotope records • Mechanisms of relationships poorly understood • To what extent did higher greenhouse gases cause greater radiative warming of the Earth's atmosphere?
Dating Ice Core Records • Ice sheets thickest in center • Ice flow slowly downward • Then flows laterally outward • Annual layers may be preserved and counted • Deposition of dust during winter • Blurred at depth due to ice deformation
Reliability of Dating • Dust layer counting • Best when ice deposition rapid • Greenland ice accumulates at 0.5 m y-1 • Layer counting good to 10,000 years • Antarctica ice accumulates at 0.05 m y-1 • Layering unreliable due to slow deposition • Where unreliable, ice flow models used • Physical properties of ice • Assumes smooth steady flow • Produces “fairly good estimates” of age
Dust Layers • Greenland has two primary sources for dust • Particulates from Arctic Canada and coastal Greenland • Large volcanic eruptions anywhere on the globe
Gas Trapping in Ice • Gases trapped during ice sintering • When gas flow to surface shut down • Crystallization of ice • Depths of about 50 to 100 m below surface • Gases younger than host ice • Fast accumulation minimizes age difference (100 years) • Slow deposition maximizes age difference (1000-2000 years)
Implication of Age Difference • If change in greenhouse gas concentrations • Force changes in ice volume • Gas concentration should lead ice volume • Gas age is younger than ice age • Therefore offset between changes in atmospheric gas concentrations • Which should be relatively rapid • Closer to change in ice volume • Which should be relatively slow
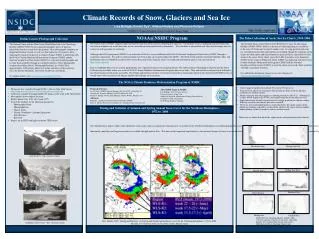
Reliability and Accuracy of Records • Can be evaluated by comparing instrumental record • With records from rapidly accumulating ice sheets • Instrumental records date to 1958 for CO2 and 1983 for CH4 • Mauna Loa Observatory (David Keeling)
NOAA/CMDL Air Sampling Network 35 Sampling stations or about half world-wide stations
Carbon Dioxide • Measurements of CO2 concentration • Core from rapidly accumulating ice • Merge well with instrumental data
Methane • Measurements of CH4 concentration • Core from rapidly accumulating ice • Merge well with instrumental data
CH4 and CO2 in Ice Cores • Given agreement between records from rapidly accumulating ice • Instrumental data • Accuracy and variability about the trends • Assume that longer-term records collected from ice cores • Reliable for determining the scale of variability
Orbital-Scale Changes in CH4 • CH4 variability • Interglacial maxima 550-700 ppb • Glacial minima 350-450 ppb • Five cycles apparent in record • 23,000 precession period • Dominates low-latitude insolation • Resemble monsoon signal • Magnitude of signals match
Monsoon forcing of CH4 • Match of high CH4 with strong monsoon • Strongly suggests connection • Monsoon fluctuations in SE Asia • Produce heavy rainfall, saturate ground • Builds up bogs • Organic matter deposition and anaerobic respiration likely • Bogs expand during strong summer monsoon • Shrink during weak summer monsoon
Alternative Explanation • High-latitude soils and continental margins source of atmospheric methane • CH4 stored in frozen soils (permafrost) • Continental margin sediments (hydrates) • Released during exceptionally warm summers • Precessional changes in summer insolation affects high latitudes • Cycles of summer warming should also occur on 41,000 year cycles • Lack of 41,000 cycle in record argues against high latitude source
Orbital-Scale Changes in CO2 • CO2 record from Vostok • Interglacial maxima 280-300 ppm • Glacial minima 180-190 ppm • 100,000 year cycle dominant • Match ice volume record • Timing • Asymmetry • Abrupt increases in CO2 match rapid ice melting • Slow decreases in CO2 match slow build-up of ice
Orbital-Scale Changes in CO2 • Vostok 150,000 record • 23,000 and 41,000 cycles • Match similar cycles in ice volume • Agreement suggests cause and effect relationship • Relationship unknown • e.g., does CO2 lead ice volume? • Correlations not sufficient to provide definite evaluation
Problems with Records • Ice cores poorly dated • CO2 older than ice by variable amount • Greenland ice core well-dated (dust layers) • Dust is CaCO3-rich • Dissolution of CaCO3 releases CO2 • Precise timing between changes in CO2 and ice volume uncertain • New data provide better correlation • Data do show that signals correlate • Some causal link must exist • Big question – how did CO2 vary by 30%?
Covariation Between CO2 and dD If the dD change reflects a proportional T drop, then more than ½ of the interglacial-to-glacial change occurred before significant removal of atmospheric CO2 • Substantial mismatch in Vostok records (r2 = 0.64 over the last 150 kya) Values shown normalized to their mean values during the mid-Holocene (5–7 kya BP) and the last glacial (18–60 kya BP) Clearly visible are the disproportionately low deuterium values during the mid-glacial (60–80 Kya BP), the glacial inception (95–125 Kya BP), and the penultimate glacial maximum (140– 150 Kya BP)
Temperature from Ice Cores • Snow falling on ice sheets under colder temperatures is more negative • A plot of the 18O of snow versus temperature shows an excellent correlation • Thus 18O serves as a paleothermometer
d18O in Ice Cores • Several factors in addition to temperature of precipitation • Affect the d18O of snow and ice on glaciers
Meteoric Water Line • dD and d18O in precipitation correlated • Determined by evaporation/precipitation and rainout • Mixture of equilibrium and non-equilibrium processes • Deuterium excess (d = dD – 8d18O) quantifies intercept and disequilibria
Deuterium Excess in Marine Rain • Deuterium-excess value in marine environments • Established at the site of the air-sea interaction • The offset from equilibrium conditions • Determined by the humidity deficit above the sea surface • This deuterium-excess value is conserved during the rainout over the continents • If humidity deficit is known or can be modeled • Can be used to correct dD/d18O of precipitation • Determine more precisely ambient temperature during precipitation
dD on Antarctica • Determine by the temperature, humidity and dD of the vapor source region • Cuffy and Vimeux (2001, Nature, 415:523-527) showed using deuterium excess • Mismatch is an artifact caused by variations in climate of the vapor source region • Used a climate model and measured deuterium excess • Calculate Southern Hemisphere temperature variations
Vostok Temperature and CO2 • Deuterium excess corrected Southern Hemisphere temperature correlate remarkably well with CO2 variations Covariation of CO2 and temperature have r2 = 0.89 for last 150 kya and r2 = 0.84 for last 350-400 kya
Implications of Results • CO2 is an important climate forcing on the Modern Earth • Long-term synchrony of glacial-interglacial cycling • Between Northern and Southern Hemispheres • Due to greenhouse gas variations and feedbacks associated with variations • Southern Hemisphere DT explained by • CO2 variations • Without considering changes in N. Hemisphere insolation • Delay between CO2 decrease and DT • During last glacial inception only ~5,000 years
Unresolved Issues • Cuffy and Vimeux (2001) show that • 90% of DT can be explained by variations in CO2 and CH4 • Reasonably firm grasp on causes of CH4 variations (Monsoon forcing) • What produced CO2 variations? • Variations are large – 30% • Show rapid changes – drop of 90 ppm from interglacial to glacial
Physical Oceanographic Changes in CO2 90% of the CO2 decrease unexplained by physical processes • During glaciations physical properties change • Temperature and salinity • Affect solubility of CO2(aq) and thus pCO2
Exchange of Carbon • Carbon in rock reservoir exchanges slowly • Cannot account for 90 ppm change in 103 y • Rapid exchange of carbon must involve near-surface reservoirs
Changes in Soil Carbon • Expansion of ice sheets • Covered or displaced forests • Coniferous and deciduous trees • Displaced forests replaced by steppes and grasslands • Have lower carbon biomass • Pollen records in lakes • Indicate glacial times were dryer and less vegetated than interglacial • Estimates of total vegetation reduced by 25% (15-30%) during glacial maxima • CO2 removed from atmosphere did not go into vegetation on land!
Where is the Missing Carbon? • Carbon from reduced CO2 during glacial times • Not explained by physical properties of surface ocean • Did not go into biomass on land • Must have gone into oceans • Surface ocean not likely • Exchanges carbon with atmosphere too rapidly • Most areas of ocean within 30 ppm of atmosphere • Glacial surface ocean must also have been lower, like atmosphere • Deep ocean only likely remaining reservoir