Download
1 / 14
140 likes | 163 Vues
This project involves detailed ground-based measurements of aerosols and precipitation, focusing on aerosol composition, size distribution, particle sources, and precipitation sampling in various locations including remote forest areas and coastal laboratories.

E N D
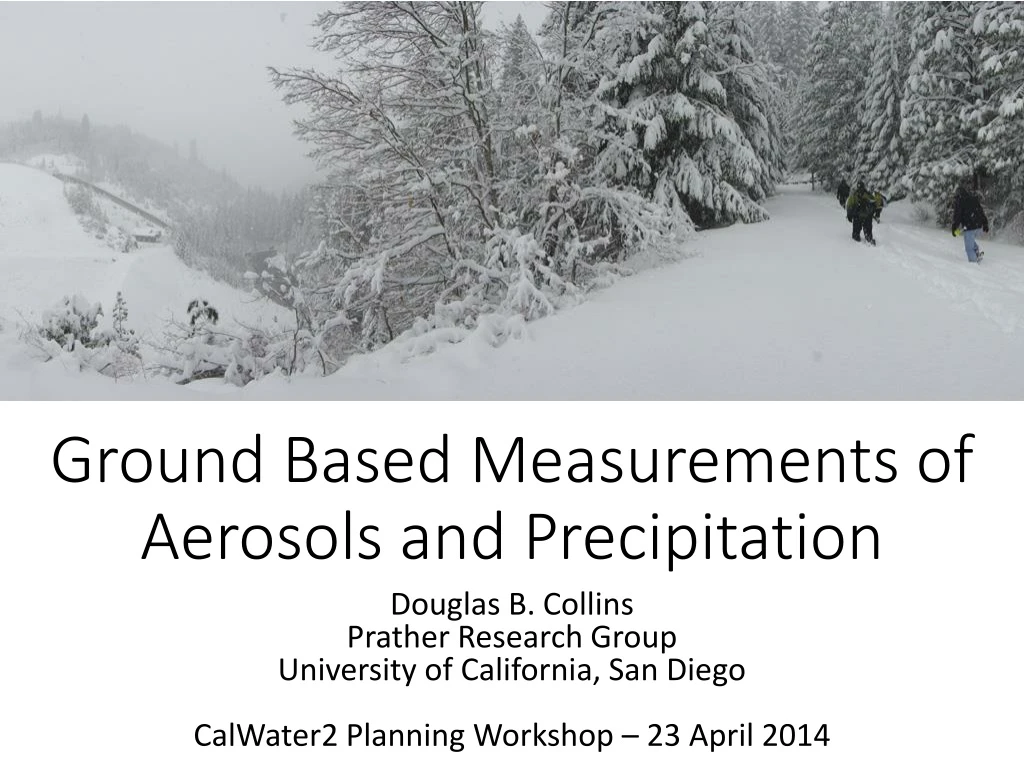
Ground Based Measurements of Aerosols and Precipitation Douglas B. Collins Prather Research Group University of California, San Diego CalWater2 Planning Workshop – 23 April 2014
UCSD/SIO Mobile Laboratory Field-Deployable Platform 20’ x 7’ Double Axle Box Trailer GVWR: 7000 lbs. Power: 100 A (220 V) Max Aerosols Composition (d = 0.1 – 3 μm): Aerosol Time-of-Flight Mass Spectrometers (ATOFMS, x2) Size Distributions (d = 0.01 – 20 μm): Scanning Mobility Particle Sizer, Aerodynamic Particle Sizer Light Absorption/Black Carbon: 7-wavelength Aethalometer Cloud Condensation Nuclei (CCN): Single Column CCN Counter, Condensation Particle Counter PM2.5 Mass: Beta Attenuation Monitor (BAM) Others: Continuous Flow Diffusion Chamber (Ice Nuclei; DeMott, Colo. State. Univ.) Aerosol Ion Chromatography, Aerosol and CCN Capillary Electrophoresis (Roberts, SIO) Trace Gases Carbon Monoxide (CO), Nitrogen Oxides (NOx), Ozone (O3), Sulfur Dioxide (SO2)
CalWater Field Sites UCSD/SIO Mobile Aerosol Laboratory Precipitation Sampling (USGS) Surface Met & Radar (HMT West/NOAA ESRL) Sugar Pine Dam (SPD): 2009, 2010, 2011 Mariposa (MPI): 2010 Bodega Bay (BBY): 2014 Aerosol Size Distributions & CCN Concentrations Precipitation Sampling (USGS) Lincoln (LHM): 2011 Precipitation Sampling (USGS) Cazadero (CZC): 2011 Shasta Dam (STA): 2011 Yosemite Snow Sampling (NPS) Crane Flat (CFT), Badger Pass (BPS), Tuolumne Meadows (TMD): 2011 STA SPD LHM CZC BBY MPI [Google Maps]
Sugar Pine Dam Foresthill Backcountry, Tahoe National Forest [Late January – Mid March] STA Elevation: 1066 m MSL Locale: Remote, Rural (>10 km from I-80) Access: 20 min drive from nearest lodging; ¼ mile hike from road (snow only) Communications: Satellite Internet (HughesNet) [No cellular or satellite phone reception] Notable features: Low aerosol concentrations (esp. coarse mode) Sierra Barrier Jet/Aerosol interactions New Particle Formation after precipitation Snow and Rain both possible at ground level SPD LHM CZD BBY MPI [Google Maps]
Sugar Pine Dam Foresthill Backcountry, Tahoe National Forest [Late January – Mid March] Ambient Particle Sources Elevation: 1066 m MSL Locale: Remote, Rural (>10 km from I-80) Access: 20 min drive from nearest lodging; ¼ mile hike from road (snow only) Communications: Satellite Internet (HughesNet) [No cellular or satellite phone reception] Notable features: Low aerosol concentrations (esp. coarse mode) Sierra Barrier Jet/Aerosol interactions New Particle Formation after precipitation Snow and Rain both possible at ground level
Bodega Bay UC Davis Bodega Marine Laboratory [February – March] STA Elevation: <10 m MSL Locale: Coastal, active laboratory Access: Lodging onsite Communications: via Bodega Marine Lab Notable features: Strong contribution from marine aerosol Central Valley influence via Petaluma Gap Coastal barrier jet formation Local burning (campfires), especially on weekends can complicate regional scale signal SPD LHM CZD BBY MPI [Google Maps]
Bodega Bay UC Davis Bodega Marine Laboratory [February – March] Ambient Particle Sources Elevation: <10 m MSL Locale: Coastal, active laboratory Access: Lodging onsite Communications: via Bodega Marine Lab Notable features: Strong contribution from marine aerosol Central Valley influence via Petaluma Gap Coastal barrier jet formation Local burning (campfires), especially on weekends can complicate regional scale signal
Bodega Bay UC Davis Bodega Marine Laboratory [February – March] Elevation: <10 m MSL Locale: Coastal, active laboratory Access: Lodging onsite Communications: via Bodega Marine Lab Notable features: Strong contribution from marine aerosol Central Valley influence via Petaluma Gap Coastal barrier jet formation Local burning (campfires), especially on weekends can complicate regional scale signal Bodega Bay vs. Sugar Pine Dam BBY has larger coarse mode, which consists of mostly sea spray aerosol
Comparative Analysis • Bodega Bay (Bodega Marine Lab) • Pros • Access to supplies, bio lab, office space • Housing is on-site data consistency • Often receives clean marine air • Petaluma gap flow, coastal jet, new particle formation • Backup power is provided (although it pollutes the air heavily) • Cons • Salty air can be problematic for electronics • Conditions (and sources) can change very quickly, real-time forecasting necessary • Occasional local pollution (easy to filter) • Sugar Pine Dam (Tahoe National Forest) • Pros • Established aerosol dataset (3 years) • Possibility for various phases of precip • Receptor site for SNR Orographic Precip • Clean, remote site • Cons • Poor communication, very remote • Access can be blocked for >24 hrs (snow) • [Can require heavy equipment] • Power can be lost for >24 hrs (snow) • Limited relationship to cloud chemistry
Adding Value with Co-Location Sugar Pine Dam, 2011 Thoughts for Future: • LIDAR, Cloud Radar • Snow Pillow and SWE • Hydrometeor Size Distributions Aerosol S-PROF Precip DRUM 449 MHz + RASS Precip Aerosol Bodega Bay, 2014
Logistical Considerations Influence of local particle sources can overshadow regional-scale trends UCSD/SIO Mobile Lab needs near-constant attention Access and communications must be reliable C. McCluskey, Colo. State
Mariposa- Yosemite Airport Mariposa, CA STA Elevation: 670 m MSL Locale: Rural, active road and air traffic Access: Short drive to lodging Communications: Generally available Notable features: Airport and truck traffic influenced signal SBJ appeared to influence aerosol (like SPD) Not strongly coupled to Central Valley Strong local sources of particles make this site not a good option for CalWater SPD LHM CZD BBY MPI [Google Maps]