Download
1 / 24
240 likes | 377 Vues
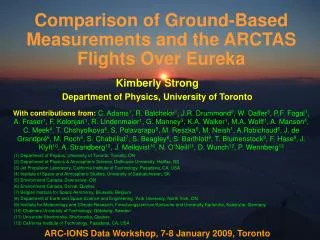
Comparison of Ground-Based Measurements and the ARCTAS Flights Over Eureka. Kimberly Strong Department of Physics, University of Toronto

E N D
Comparison of Ground-Based Measurements and the ARCTAS Flights Over Eureka Kimberly Strong Department of Physics, University of Toronto With contributions from: C. Adams1, R. Batchelor1, J.R. Drummond2, W. Daffer3, P.F. Fogal1, A. Fraser1, F. Kolonjari1, R. Lindenmaier1, G. Manney3, K.A. Walker1, M.A. Wolff1, A. Manson4, C. Meek4, T. Chshyolkova4, S. Polavarapu5, M. Reszka5, M. Neish1, A.Robichaud6, J. de Grandpré6, M. Roch6, S. Chabrillat7, S. Beagley8, S. Barthlott9, T. Blumenstock9, F. Hase9,J. Klyft10, A. Strandberg10, J. Mellqvist10, N. O’Neill11, D. Wunch12, P. Wennberg12 (1) Department of Physics, University of Toronto, Toronto, ON (2) Department of Physics & Atmospheric Science, Dalhousie University, Halifax, NS (3) Jet Propulsion Laboratory, California Institute of Technology, Pasadena, CA, USA (4) Institute of Space and Atmospheric Studies, University of Saskatchewan, SK (5) Environment Canada, Downsview, ON (6) Environment Canada, Dorval, Quebec (7) Belgian Institute for Space Aeronomy, Brussels, Belgium (8) Department of Earth and Space Science and Engineering, York University, North York, ON (9) Institute for Meteorology and Climate Research, Forschungszentrum Karlsruhe and University Karlsruhe, Karlsruhe, Germany (10) Chalmers University of Technology, Göteborg, Sweden (11) Universite Sherbrooke, Sherbrooke, Quebec (12) California Institute of Technology, Pasadena, CA, USA ARC-IONS Data Workshop, 7-8 January 2009, Toronto
The PEARL at Eureka • Polar Environment Atmospheric Research Laboratory • Formerly Env. Canada’s Arctic Stratospheric Ozone Observatory • Run by the Canadian Network for Detection of Atmospheric Change (CANDAC) since August 2005 • Three facilities: PEARL ridge lab, ØPAL, and SAFIRE • Located on Ellesmere Island, Nunavut (80°N, 86°W) • 15 km from Eureka Weather Station • 1100 km from North Pole
Tobias Kerzenmacher PEARL Research Themes • PEARL research is divided into four themes: • Arctic Troposphere Transport and Air Quality • The Arctic Radiative Environment • Impacts of Clouds, Aerosols and Diamond Dust • Middle Atmospheric Chemistry in the Arctic • Waves and Coupling Processes • Other significant research activities • Satellite Validation • Sudden Events
PEARL Stratospheric Ozone Lidar Bruker 125HR FTS UV-Visible Spectrometer Michelson Wind Interferometer (ERWIN) Spectral Imaging Interferometer (SATI) All Sky Imager Aerosol Mass Spectrometer (AMS) Cimel Sun Photometer Extended-range Atmospheric Emitted Radiance Interferometer (E-AERI) Meteorological instruments Brewer Spectrophotometer (EC) ØPAL Millimeter Cloud Radar High Spectral Resolution Lidar Meteor Radar Polar Atmospheric Emitted Radiance Interferometer (P-AERI) Microwave H2O radiometer Tropospheric Ozone Lidar Rayleigh/Mie/Raman Lidar Cimel Sun Photometer Precipitation Sensor Suite SAFIRE VHF radar BSRN Flux Tower PEARL Instruments Green = currently installed Blue = “guest instrument”
1999 2001 2008 2006 2008 2007 2008 2006 Clive Midwinter UV-Visible Spectrometer • New PEARL-GBS instrument installed in August 2006 • Side-by-side with UT-GBS instrument (10th Arctic campaign) • Recently installed sun-tracker for multi-axis scanning and direct solar observations greater tropospheric sensitivity • Daily automated zenith-sky measurements • O3, NO2, BrO, OClO columns 2008
Vortex over Eureka NO2 recovers in Spring (complicated by vortex dynamics). NO2 decreases in Fall as sunlight decreases. Day 2006 Day 2007 Day 2008 First Two Years of O3 and NO2 C. Adams, A. Fraser
PEARL Bruker FTS • PEARL Bruker IFS 125HR Fourier Transform Spectrometer installed July 2006 • Daily semi-automated solar infrared absorption measurements • Need direct sun - late February to late October • Solar tracker • High spectral resolution (up to 0.0024 cm-1) • InSb and MCT detectors, KBr beamsplitter • Vertical profiles and columns retrieved using optimal estimation (SFIT2 v3.92c) • Reactive species, source gases, reservoirs, dynamical tracers • O3, NO, NO2, HNO3, ClONO2, HCl, OClO, HF, N2O, CFCs, CO, CH4, C2H6, HCN, OCS, CO2, ...
The First Two Years of FTS Data O3 HFa tracer HCl chlorine reservoir ClONO2 chlorine reservoir HNO3nitrogen reservoir Red boxes indicate spring 2007 & spring 2008 R. Batchelor, R. Lindenmaier
Spring 2007 FTS Data 2007: The vortex was above Eureka for a large part of the campaign. O3 HClchlorine reservoir HF a tracer HNO3 nitrogen reservoir ClONO2chlorine reservoir sPV R. Batchelor, R. Lindenmaier; sPV data - G. Manney & W. Daffer; PV plot - A. Dornbrack & ECMWF
Mar. 13 Spring 2008 FTS Data 2008: Sudden stratospheric warming in mid-February and very little vortex activity above Eureka during March O3 HClchlorine reservoir HF a tracer HNO3 nitrogen reservoir ClONO2chlorine reservoir sPV Mar 13 R. Batchelor, R. Lindenmaier; sPV data - G. Manney & W. Daffer; PV plot - A. Dornbrack & ECMWF
Barrow, Alaska, USA Poker Flat Ny Alesund, Svalbard, Norway Eureka, Canada Eureka Ny Alesund Thule Kiruna Harestua Summit, Greenland, Denmark Alomar, Norway Tiksi, Russia Alert, Canada IASOA and NDACC Stations IASOA = International Arctic Systems for Observing the AtmosphereNDACC = Network for Detection of Atmospheric Composition Change
Other Arctic FTS Stations • Six NDACC FTS instruments are located north of 60º • Network for the Detection of Atmospheric Composition Change • Poker Flat, Kiruna, Harestua, Ny Alesund, Thule, Eureka R. Batchelor Kiruna: S. Barthlott, T. Blumenstock, F. Hase Harestua: J. Klyft, A. Strandberg, J. Mellqvist
Eureka Ny Alesund Thule Kiruna Poker Flat Harestua Spring 2007 Arctic Vortex Polar vortex edge at 600 K (~22 km) identified using Q diagnostic • a measure of the rotation and strain in a wind field Days 1 to 100, 2007 Data and movie by Chris Meek (U. Sask) A. Manson, C. Meek, T. Chshyolkova
The First Two Years of FTS Data CO C2H6 HCN CH4 N2O Tropospheric Species R. Batchelor, R. Lindenmaier
DC-8 Flight Path NASA DC-8 and P-3 spiral over Eureka, April 8 2008 1600Z Plots by Debra Wunch, Caltech/JPL Photos courtesy of Rich DeVall, Environment Canada
7880 cm-1 O2 Band 6220 cm-1 CO2 Band MIR measurements NIR measurements Trial Near IR Measurements • 8 April 2008 tests during ARCTAS campaign - NASA DC-8 and P-3 research aircraft flew spirals over Eureka • Used CaF2 beamsplitter and InSb detector (not standard TCCON configuration) Measurements by Rebecca Batchelor U of Toronto
Eureka Near IR - Example Fit April 5, 2008trial measurements Plots and analysis by Debra Wunch, Caltech/JPL
April 8, 2008 Plots and analysis by Debra Wunch, Caltech/JPL
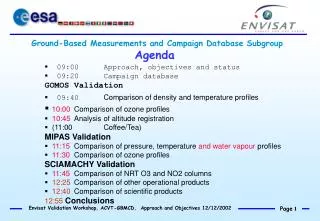
IPY: Models and Measurements “To have any hope of understanding the current global climate and what might happen in future the science community needs a better picture of conditions at the poles and how they interact with and influence the oceans, atmosphere and land masses. Existing climate models do not work well in the polar regions...” IPY websitehttp://classic.ipy.org/about/what-is-ipy.htm • Special IPY model runs have been produced for 2007/2008 • Comparing measurements to models allows us to assess how well these model runs are simulating conditions near the poles • Models can be used to help interpret measurements • dynamically versus chemically • in relation to the Arctic as a whole
IPY Data Assimilation Models • The Canadian Middle Atmosphere Model – Data Assimilated (CMAM-DA) • 96 x 48 points covering the globe, with 71 layers from the troposphere (high resolution) to the mesosphere (3 km resolution) • Stratospheric gas phase chemistry • Tropospheric methane chemistry only • 3D-Var FGAT assimilation of meteorological fields • Environment Canada’s Global Environmental Multiscale stratospheric model, run with the BIRA (Belgian Institute for Space Aeronomy) online chemistry package (GEM-BACH) • 1.5 degree (240 x 120) resolution, 80 levels with a lid at 0.1 hPa • A hybrid model, with the benefits of meteorological assimilation from GEM-Meso-Strato and the advantages of an online chemistry package executed every time step • 3D-Var FGAT assimilation of meteorological fields
Excellent agreement for both GEM-BACH and CMAM-DA GEM-BACH CMAM-DA Stratospheric N2O Comparisons R. BatchelorModel data provided by the GEM-BACH and CMAM teams.
Excellent agreement for both GEM-BACH and CMAM-DA CMAM-DA GEM-BACH Stratospheric O3 Comparisons R. BatchelorModel data provided by the GEM-BACH and CMAM teams.
Summary • PEARL site is now well established at Eureka • First two years of data from UV-visible & FTS instruments • Measurements of O3, CO, CO2, BrO, and other gases during spring 2008 ARCTAS campaign • Analysis and interpretation is ongoing • Spring measurements require careful interpretation • Polar vortex dynamics tend to dominate observed concentrations • IPY meteorologically assimilated models GEM-BACH and CMAM-DA generally do • A good job of reproducing stratospheric chemistry • A very good job of reproducing stratospheric dynamics • Other model and satellite comparisons underway • GEOS-Chem, SLIMCAT, KASIMA, ACE, AIRS, Aura, ...
Acknowledgements • CANDAC and PEARL are supported by • AIF/NSIRT, CFCAS, CFI, CSA, EC, GOC-IPY, MRI, MSC, NSERC, OIT, PCSP, SEARCH • The Canadian Arctic ACE Validation Campaigns are supported by • CSA, EC, NSERC, NSTP, CGCS • Logistical and operational support at Eureka is provided by • CANDAC/PEARL Principal InvestigatorJames R. Drummond • PEARL Site Manager Pierre Fogal • The CANDAC operators • The wonderful team at EC’s Weather Station • The GEM-BACH and CMAM-DA teams • The EU projects GEOMON and SCOUT-O3 • NASA and ARCTAS