CAUSE AND EFFECT DIAGRAM
CAUSE AND EFFECT DIAGRAM. Fishbone . Developed from the Contents of Reginald Leon Green’s. Practicing the Art of Leadership: A Problem-based Approach to Implementing the ISLLC Standards Chapter 5. The Cause and Effect (CE) Diagram.

CAUSE AND EFFECT DIAGRAM
E N D
Presentation Transcript
CAUSE AND EFFECT DIAGRAM Fishbone
Developed from the Contents of Reginald Leon Green’s Practicing the Art of Leadership: A Problem-based Approach to Implementing the ISLLC Standards Chapter 5
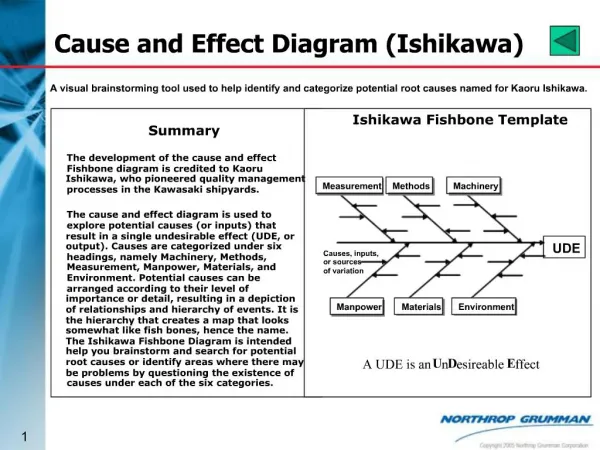
The Cause and Effect (CE) Diagram • Created in 1943 by Professor Kaoru Ishikawa of Tokyo University and adopted by Dr. W. Edwards Deming
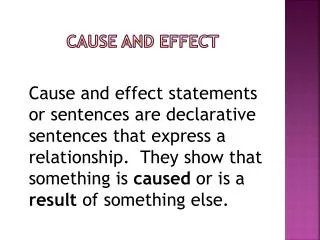
Basic Use of the CE Diagram • The CE Diagram is basically used to investigate a problem, exploring, identifying, and displaying the possible causes.
Purpose of the CE Diagram • To identify the relationship between the effects in a given situation and all of the possible causes • To find problem sources/solutions
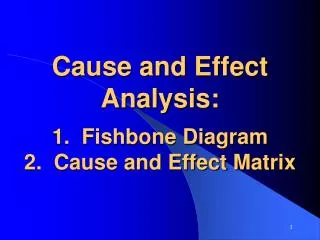
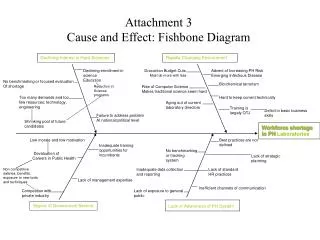
The Fishbone Diagram An Analysis Tool
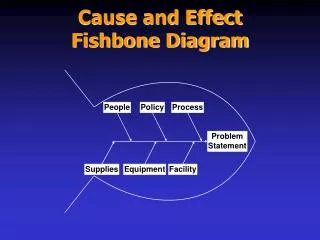
The Fishbone Diagram • A tool used to analyze possible causes of a specific problem or condition
Analyzing the Cause • Why has membership in Advance Placement courses decreased? • Why are students not participating in extra-curricular activities?
Major Causes By Categories • People – The faculty • Policies – Stated requirements • Procedures – The implementation process • The School Building – The physical plant
The CE Process • Identify the problem to be corrected • Identify any possible causes of the problem
The CE Process • Question the cause of problems in each area, seeking changes that are deviations from the norm • Repeat for each sub-area
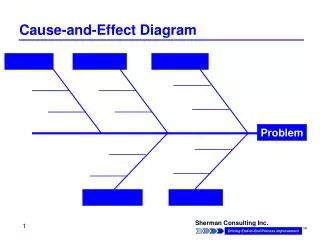
Constructing The Diagram 1. Clearly describe the problem, i.e., the "effect," to be diagrammed (for example: files out of place, too many students in line, or attendance below average). 2. Draw a box around the effect with an arrow heading to it. EFFECT
Constructing The Diagram 3. Identify the major categories of factors that contribute to the problem and write them on the diagram. • This will help the faculty organize the causes.
Constructing The Diagram 4. Brainstorm the detailed factors that contribute to the problem (i.e., the "effect"). • Ask for each factor, “What causes this factor?" • Write the causes on the diagram and connect them to the appropriate main category.
Constructing the Diagram 5. Identify any and all sub-causes and place them on the diagram. Continue to ask "why" until the root causes are identified.
Sample Fishbone Diagram • An Internet example of a fishbone diagram can be found at the following URL addresses: • http://www.hci.com.au/hcisite/Toolkit/causeand.htm#Discover underlying causes • http://bellnet.tamu.edu/ExFishDiag.htm • http://cbpa.louisville.edu/boyd/CHAP03_Revised/sld069.htm • http://www.goalqpc.com/RESEARCH/MJII/C%26E.html
Constructing the Diagram • Fishbone Diagram: MATERIALS FACULTY EFFECT EQUIPMENT METHODS
Reference The memory jogger for education. (1992). Methuen, MA: GOAL/QPC.
Internet References: • Cause & Effect Diagram. http://cbpa. louisville.edu/boyd/CHAP03_Revised/tsld068.htm • Why Use the Cause & Effect (Fishbone) Diagram? Find and cure causes, NOT symptoms. The Memory JoggerTM II http://www.goalqpc.com/RESEARCH/MJII/C%26E.html
Internet References: • Discover underlying causes. http://www. hci.com.au/hcisite/Toolkit/causeand.htm • Cause and Effect Diagram. http://deming. eng.clemson.edu/pub/tutorials/qctools/cedm.htm#history • Cause & Effect Diagram. http://www1.star-net.or.jp/prex/new_virtual/web_qc/qc_doc/tlqc006.htm
Internet References: • Ishikawa's Message. http://www.dmu.ac. uk/dept/schools/business/corporate/tqmex/ish.htm