Download
1 / 39
390 likes | 471 Vues
Truckee River Water Quality Standards Review. Focus Group Meeting: September 27, 2013. Overview of Topics for Discussion. Feedback from previous workshop? Review of flow regime development Adjustment to 10 th percentile flow regime Preliminary WQ results Interpretation of Results

E N D
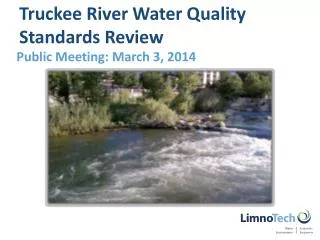
Truckee River Water Quality Standards Review Focus Group Meeting: September 27, 2013
Overview of Topics for Discussion • Feedback from previous workshop? • Review of flow regime development • Adjustment to 10th percentile flow regime • Preliminary WQ results • Interpretation of Results • Integration of results over range of flows • Preliminary climate change sensitivity runs • Next steps
Topics for Comment from August 2013 Focus Group Meeting • Approach for applying WARMF and TRHSPF to evaluate potential changes to the Truckee River Nutrient Water Quality standards • Approach for establishing a flow regime based on TROM Future No Action scenario • Approach for analysis and interpretation of model results • Any overarching concerns regarding the water quality standards review process?
Selection of Representative Flow Conditions • Derived “target flows” based on TROM Future No Action output • Two representative flow regimes selected to date • Low Flow (10th percentile) • Average Flow (50th percentile)
1977 FNA Comparison of TROM, 10th percentile flows, and TRHSPF • Only adjusted summer period for lower river ONLY Adjusted at TCID
Refining 10th Percentile Flow Regime Closer to Target • Preliminary runs performed with only minor adjustment to 1977 FNA (at Derby Dam) • Working Group recommended further adjustment for 1977 above Derby Dam • Final results with adjusted flows are “in process” • Single test run completed • Biggest change in Reach 1
1977 FNA Comparison of TROM, 10th percentile flows, and TRHSPF • Adjusted at WARMF-TRHSPF interface • July, August decreased flow • September increased flow • Adjusted summer period for lower river Adjusted at Sparks Jul - Sep ONLY Adjusted at TCID Adjusted at TCID
Single Test Run with Adjusted 10th Percentile Low Flow TN Ortho-P Proceeding with running adjusted 10th percentile flow for full suite of constituent concentrations
1985 FNA Comparison of TROM, 50th percentile flows, and TRHSPF • No additional adjustment
Preliminary Results of 10th Percentile Low Flow Condition (Does not include adjusted flow regime)
Options for Calculating Percent Violation of DO WQS % of Hours: attainment is aggregation of all hours that have violated WQS X hours violated 8760 hours/yr % of Days: if 1+ hours violate WQS on a given day, that day is not in attainment X days violated 365 days/yr Reviewing attainment as“% of days” is more conservative approach
Preliminary Results Total P10th Percentile Flow: Reach Averaged % of Days % of Hours TN = 0.75 TN = 0.75
Preliminary Results Ortho-P10th Percentile Flow: Reach Averaged % of Days % of Hours TN = 0.75 TN = 0.75
Preliminary Results Total Nitrogen10th Percentile Flow: Reach Averaged % of Days % of Hours
Preliminary Results: Longitudinal Plots TN = 0.75 mg/L, OP = 0.05 mg/L
Preliminary Results Total P50th Percentile Flow: Reach Averaged % of Days % of Hours TN = 0.75 TN = 0.75
Preliminary Results Ortho P50th Percentile Flow: Reach Averaged % of Days % of Hours TN = 0.75 TN = 0.75
Preliminary Results Total N50th Percentile Flow: Reach Averaged % of Days % of Hours
Preliminary Results: Longitudinal PlotsTN = 0.75 mg/L, OP = 0.05 mg/L
Preliminary Observations • Reaches 1, 2, 3 show low level of DO violation • Reach 4 is most critical at 10th percentile flow • Sensitive to the phosphorus concentration • Not sensitive to the TN concentration • No violations for 50th percentile flows • Need further investigation of Reach 4 response
Integration of Results Over Full Flow Regime • Working Group discussed potential merit of running a 90th percentile (high flow) regime • Could consider an “integration” of DO violations across all flow regimes • Spreadsheet calculation based on preliminary results • 90th percentile year not simulated • Conservative assumption: high flow violations same as average year
Comparison of 10th and 50th Flow Regime Results: Total P 50th Percentile Flow 10th Percentile Flow TN = 0.75 TN = 0.75
Preliminary Climate Change Scenario • Identified by Focus Group as important consideration for sensitivity analysis • Focus only on temperature increase • Given highly managed system, reservoir management could override climate change influences in upper watershed • Climate models predict wide variation in precipitation changes • General approach for sensitivity runs • Only adjust TRHSPF air temperature inputs – air water exchange • Apply a 1° F air temperature increase across entire year • Present the results on a "per degree" basis • Although linear response not expected, reasonable first step
Basis for 1° F Temperature Increase • USBR Truckee River Basin Study (2012-2014) • Evaluate range of potential changes in water demands due growing population • Compare demands to existing supply under potential future uncertainties, including climate change • Will include use of climate model projections Approximate 1° F increase over 20 years SOURCE: USBR, 2013. Truckee Basin Study, Technical Advisory Group Water Supply Workshop, June 24, 2013 http://www.usbr.gov/mp/TBStudy/
TP Climate Sensitivity Example: 10th Percentile Flow (TN 0.75 / TP 0.05)
Geomorphology Considerations • Potential relationship between channel geometry and most critical segments • Mapped selected parameters for each model segment • Reach slope • Water depth (summer average; 10th percentile year) • Water velocity (summer average; 10th percentile year) • Developed an “indicator” of segment-specific diurnal swing • Calculated for two-segment average to account for influence by the diurnal in the prior segment
Justification for Indicator • Violations are caused primarily by the magnitude of the diurnal swing • Diurnal swing at steady state directly proportional to: gross plant productivity (g O2/m3/day) / [reaeration rate] • Gross plant productivity = areal productivity (g O2/m2/day) / [water depth] • Reaeration proportional to:[velocity * slope] • Diurnal swing = areal productivity / [depth * velocity * slope] • With similar periphyton productivity across segments, [depth * velocity * slope]should be a good indicator of segment-specific diurnal
Average Depth (Summer Mean) Marble Bluff Dam (343) Tracy (315) Vista (304) Below Derby Dam (320)
Channel Slope Marble Bluff Dam (343) Tracy (315) Vista (304) Below Derby Dam (320)
Average Velocity (Summer Mean) Marble Bluff Dam (343) Tracy (315) Vista (304) Below Derby Dam (320)
Reach Geometry Index Marble Bluff Dam (343) Tracy (315) Vista (304) Below Derby Dam (320)
Next Steps • Focus Group comments / feedback: • Technical approach • Finalization of WQS model runs/output interpretation • Finalize “adjusted” 10th percentile flow runs with all constituent concentrations • Climate sensitivity simulations • Development of Technical Rationale Report
Upcoming Focus Group Workshops • Early Nov, 2013 (TBD) *NEW DATE* • Final modeling results • Jan 15, 2014 (W) • Technical Rationale document • Additional Stakeholder / Focus Group meetings TBD in 2014