Download
1 / 119
1.19k likes | 1.36k Vues
This report is being submitted to fulfill the requirements of RFP #2012-65. Detailed Fact-base: Post-Secondary Online Expansion in Florida. November 16, 2012. Detailed Fact Base. Strategy Detail National Post-Secondary Online Market Examples of Innovative Models Florida Persistence

E N D
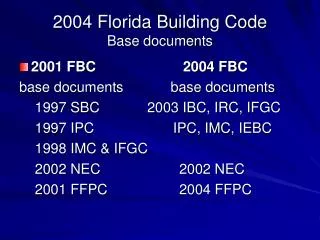
This report is being submitted to fulfill the requirements of RFP #2012-65 Detailed Fact-base: Post-Secondary Online Expansion in Florida November 16, 2012
Detailed Fact Base Strategy Detail National Post-Secondary Online Market Examples of Innovative Models Florida Persistence Florida Online Enrollments Florida Online Programs Florida Tuition and Fees Florida Employment Florida Virtual Campus Accreditation Detail Stakeholder Interviews
Strategy DetailStrategy 1: Institutions develop online offerings of their own accord, driving innovation in a way that best fits each school’s mission 1 Program Design Marketing and Inquiry Onboarding/ Student Support Course Scheduling Instruction IT and Data Analytics Each institution may choose to partner with other SUS/FCS institutions or a private partner • Local faculty drive program identification and design • Institution-level best practices • Limited statewide coordination of labor-market needs • Local marketing and lead generation • 40+ brands and value propositions state-wide • Shares student services with onsite/hybrid • Limited experiential data-sets • Local career / job placement services • Driven by faculty and classroom availability • Course availability and start dates driven by institutional calendar • Shared online/onsite faculty • Class sizes similar to onsite • Each institution chooses its own LMS, ERP, and SIS • Local data analytics • FLVC continues to manage statewide computer-assisted advising system Note: LMS: Learning Management System; ERP: Enterprise Resource Planning; SIS: Student Information System Source: Interviews with FLVC, SUS Board of Governors, SACS staff
Strategy DetailStrategy 2: Coordinating body (e.g., FLVC/BoG/FL DoE) coordinates development of complementary course and degree program offerings across the system 2 Program Design Marketing and Inquiry Onboarding/ Student Support Course Scheduling Instruction IT and Data Analytics Participating Institutions and/or Coordinating Body may choose to partner with a private partner • Coordinated program offerings • Individual institutions design courses within given parameters • Coordination of labor-market needs through coordinating body or an institution • Marketing and lead generation is coordinated centrally and executed by coordinating body or an institution • Prospective candidates referred to institution admissions offices • Student support is delivered centrally by coordinating body or an institution • Job placement supports are developed by collaboration of institutions and delivered by coordinating body or an institution • Centrally coordinated to maximize course utilization • Individual institutions use their own LMS, ERP, and SIS • Central data analytics team (at coordinating body or an institution) provides analytic support to institutions • Instruction is delivered by individual institution professors and available state-wide Note: LMS: Learning Management System; ERP: Enterprise Resource Planning; SIS: Student Information System Source: Interviews with FLVC, SUS Board of Governors, SACS staff
Strategy DetailStrategy 3: Lead institution(s) develops and offers new models across the system 3 Program Design Marketing and Inquiry Onboarding/ Student Support Course Scheduling Instruction IT and Data Analytics Lead institution may choose to partner with other SUS/FCS institutions and/or a private partner • Lead institution(s) is selected through a competitive grant process to develop and deliver new online programs within grant parameters • Lead institution(s) may choose to partner with SUS/FCS, other institutions, or a private partner • Lead institution markets state-wide • Enrollment management handled by lead institution • Student supports are developed and coordinated at the lead institution or through a partner organization • Job placement supports are developed lead institution • Coordinated by lead institution to meet parameters of grant • Instruction could be delivered by the lead institution or through partner organization • Utilize current faculty and new teaching staff • All data analytics are overseen by the lead institution Note: LMS: Learning Management System; ERP: Enterprise Resource Planning; SIS: Student Information System Source: Interviews with FLVC, SUS Board of Governors, SACS staff
Strategy DetailStrategy 4: New online institution is created to focus exclusively on the development of new models 4 Program Design Marketing and Inquiry Onboarding/ Student Support Course Scheduling Instruction IT and Data Analytics New online institution may choose to partner with other SUS/FCS institutions and/or a private partner • New online institution develops innovative programs to offer system-wide • Course development occurs at the new institution, coordinated with labor-market needs state-wide • New brand created for Florida online institution • Inquiry and lead generation is coordinated by the new institution • Utilize best practices of data-driven student support services • Designed to meet needs of 100% online target student • Flexible starts • Synchronous and asynchronous content • Non-research faculty deliver all online content • Designed and built to meet the needs of the 100% online student Note: LMS: Learning Management System; ERP: Enterprise Resource Planning; SIS: Student Information System Source: Interviews with FLVC, SUS Board of Governors, SACS staff
Strategy DetailTimeline – Strategy 1 Institution-by-Institution* Note: *Timeline applies to one institution. In this model, institutions are continually deciding whether to participate **Year 1 on all charts corresponds to year 1 on financial models Northern Arizona University timeline benchmark of one year for development of new online degree programs
Strategy DetailTimeline – Strategy 2 Institutional Coordination
Start Up Expenditure Strategy DetailStrategies will necessitate levels of initial investment ranging from ~$30-70M Recurring Expenditure System Volume System Expenditure Benchmarks Start-Up Expenditures Associated with Each Approach to Online Expansion • Over the past 10 years, a number of online institutions have been started or built from existing institutions; Figures cited by these institutions about their initial investments inform this model • Overall: WGU needed $40-$50M over the first four years of its existence for start-up related expenditure • Building: WGU required a building for 400 student support professionals. Industry standards suggest call centers require 150 sq. ft per person at an estimated $250 per square foot in Florida • Information Technology: UCAL invested $4.3M to build a state of the art Learning Management System. Initial investment in ERP systems range from $1-3M; student information systems can necessitate an additional $1-2M of upfront investment. • Brand Building: WGU requested $10-$15M for brand building in Florida. SNHU spent $15M on marketing when they decided to take programs national • Program Design: Program expenditures vary tremendously across institutions. Best-in-class course design expenditures estimated at $5K-$10K per unique course. Degree programs require 10-40 unique courses. Course materials can be leveraged for both credit based and competency based programs • Institutional Leadership: A new Institution will require an Institution head and a small staff of 10-15 highly skilled individuals to create the basic infrastructure needed to run a post-secondary institution and gain accreditation $70M $65M $65M $50M $48M $45M $45M $43M $43M $38M $33M $33M * Program design will take place over the 10 year time period Note: Dotted lines represent range of total start-up expenditure; Institutional leadership becomes a recurring expenditure as FTEs begin to enroll; ERP: enterprise resource planning, LMS: learning management system, SIS: student information system Source: ~85+ Institution and expert interviews were conducted by Parthenon for the Florida engagement as well as multiple proprietary projects, from July-November 2012
Start Up Expenditure Strategy DetailStart-Up Expenditure Assumptions Recurring Expenditure System Volume System Expenditure • Institution by Institution • Institutional Collaboration • Lead Institution(s) • New Online Institution • Facilities Benchmark: WGU facility holds 400 people ($18M) Benchmark: UCAL needed $4.3M to build new LMS • Information Technology Benchmark: WGU brand building efforts ($20M) • Brand Building • Program Design Benchmark: Estimated $10K per course; Average $300K for a full degree program Benchmark: Estimated need • Institutional Leadership Source: IPEDS; ~85+ Institution and expert interviews were conducted by Parthenon for the Florida engagement as well as multiple proprietary projects, from July – November 2012
Start Up Expenditure Strategy DetailRecurring FTE Expenditures – Institution by Institution Recurring Expenditure System Volume System Expenditure Recurring Expenditures per FTE for Online Instruction, by Degree and Program Type Key Assumptions • Bachelor’s and Graduate • Credit-Based Programs • Benchmarked on current average Florida SUS expenditures per FTE excluding research, public services and other non core expenses • Competency-Based Programs • Instructional expenses are based on WGU expenditures per FTE; Support expenditures are 20% higher than WGU expenditures due to lack of scale and inefficiency of duplicating business processes across institutions • Associate’s and Undergraduate Certificate • Credit-Based Programs • Benchmarked on current average FCS expenditures per FTE excluding research, public services and other non core expenses • Competency-Based Programs • Instructional expenses based on SNHU’s Competency AS program estimated expenditures per FTE; Support expenditures are 20% higher than SNHU’s expenditures due to lack of scale and inefficiency of duplicating business processes across institutions Bachelor’s and Graduate Associate’s and Undergraduate Certificate Source: IPEDS; ~85+ Institution and expert interviews were conducted by Parthenon for the Florida engagement as well as multiple proprietary projects, from July – November 2012, FL DOE
Start Up Expenditure Strategy DetailRecurring FTE Expenditures – Institutional Collaboration Recurring Expenditure System Volume System Expenditure Recurring Expenditures per FTE for Online Instruction, by Degree and Program Type Key Assumptions • Bachelor’s and Graduate • Credit-Based Programs • Instructional expenses benchmarked on current average Florida SUS costs per FTE; Supports costs are 10% lower than SUS costs due to scale efficiencies and improved centralized business processes • Competency-Based Programs • Instructional expenses are based on WGU costs per FTE; Support costs are 10% higher than WGU costs due to inefficiency of coordinating business processes across institutions • Associate’s and Undergraduate Certificate • Credit-Based Programs • Instructional expenses benchmarked on current average Florida FCS costs per FTE; Supports costs are 10% lower than FCSS costs due to scale efficiencies and improved centralized business processes • Competency-Based Programs • Instructional expenses based on SNHU’s Competency AS program estimated costs per FTE; Support costs are 10% higher than SNHU’s costs due to inefficiency of coordinating business processes across institutions Bachelor’s and Graduate Associate’s and Undergraduate Certificate Source: IPEDS; ~85+ Institution and expert interviews were conducted by Parthenon for the Florida engagement as well as multiple proprietary projects, from July – November 2012; FL DOE
Start Up Expenditure Strategy DetailRecurring FTE Expenditures – Lead Institution(s) Recurring Expenditure System Volume System Expenditure Recurring Expenditures per FTE for Online Instruction, by Degree and Program Type Key Assumptions • Bachelor’s and Graduate • Credit-Based Programs • Centralized structure enables lead institution to reach target benchmarked on SNHUs costs per FTE • Competency-Based Programs • Centralized structure enables lead institution to reach target benchmarked on WGU costs per FTE • Associate’s and Undergraduate Certificate • Credit-Based Programs • Centralized structure enables lead institution to reach target benchmarked on Rio Salado costs per FTE • Competency-Based Programs • Centralized structure enables lead institution to reach target benchmarked on SNHU’s Competency AS program’s estimated costs per FTE Bachelor’s and Graduate Associate’s and Undergraduate Certificate Source: IPEDS; ~85+ Institution and expert interviews were conducted by Parthenon for the Florida engagement as well as multiple proprietary projects, from July – November 2012
Start Up Expenditure Strategy DetailRecurring FTE Expenditures – New Online Institution Recurring Expenditure System Volume System Expenditure Recurring Expenditures per FTE for Online Instruction, by Degree and Program Type Key Assumptions • Bachelor’s and Graduate • Credit-Based Programs • Centralized structure enables new institution to reach target benchmarked on SNHUs costs per FTE • Competency-Based Programs • Centralized structure enables new institution to reach target benchmarked on WGU costs per FTE • Associate’s and Undergraduate Certificate • Credit-Based Programs • Centralized structure enables new institution to reach target benchmarked on Rio Salado costs per FTE • Competency-Based Programs • Centralized structure enables new institution to reach target benchmarked on SNHU’s Competency AS program’s estimated costs per FTE Bachelor’s and Graduate Associate’s and Undergraduate Certificate Source: IPEDS; ~85+ Institution and expert interviews were conducted by Parthenon for the Florida engagement as well as multiple proprietary projects, from July – November 2012
Start Up Expenditure Strategy DetailSystem Volume – Enrollment Projections and Benchmarks Recurring Expenditure System Volume System Expenditure 1 2 Institution by InstitutionEnrollment Projection (FTE) Institutional CollaborationEnrollment Projection (FTE) Enrollments depend on individual institutions willingness to participate, limiting the accuracy of any prediction • Institution by Institution • Benchmark: Enrollment ramp will begin slowly as institutions gradually opt to participate. By year 6, program creation will begin to level out at 25 programs per year. Benchmarks indicate roughly 5 years ramp for a program to reach maturity at 500 in both credit- and competency-based programs • Institutional Collaboration • Benchmark: The Kentucky Community and Technical College System has fundamentally centralized control and development of new innovative online programs. The KCTCS has reached 1,000 enrollments by year 3 of their Kentucky On Demand project which now accounts1% of total enrollments in the system Source: ~85+ Institution and expert interviews were conducted by Parthenon for the Florida engagement as well as multiple proprietary projects, from July – November 2012
Start Up Expenditure Strategy DetailSystem Volume – Enrollment Projections and Benchmarks Recurring Expenditure System Volume System Expenditure 3 4 Lead Institution and New Online Institution Enrollment Projections (FTE) Methodology • Benchmarks: Over the past 10 years a number of institutions have transformed into online universities and experienced substantial enrollment growth • Lead Institution: Enrollment projection represents the average of the enrollment growth of three comparable institutions • New Online Institution: Enrollment growth is assumed to be 2-3 years behind comparable institutions average due to brand building needs, infrastructure requirements, and accreditation time frame; WGU went through a similarly slow enrollment ramp-up as it sought accreditation and built brand awareness. Colorado State University – Global Campus is currently experiencing similar growth Source: IPEDS
Start Up Expenditure Strategy DetailSystem Volume – Total Volume Estimates Recurring Expenditure System Volume System Expenditure Note: 1.2 Enrollments per FTE benchmarked against national averageSource: IPEDS; ~85+ Institution and expert interviews were conducted by Parthenon for the Florida engagement as well as multiple proprietary projects, from July – November 2012
Start Up Expenditure Strategy DetailSystem Volume – Enrollment Projections by Degree Level Recurring Expenditure System Volume System Expenditure
Start Up Expenditure Strategy DetailSystem Volume – FTE Enrollment Projections by Degree Level Recurring Expenditure System Volume System Expenditure
Start Up Expenditure Strategy DetailSystem Volume – Completion Projections by Degree Level Recurring Expenditure System Volume System Expenditure
Start Up Expenditure Strategy DetailSystem Expenditure – Total Expenditure Projections Recurring Expenditure System Volume System Expenditure Total Expenditure by Strategy, 10 Year Forecast Note: Start-Up Expenditures are amortized across 10 years
Strategy DetailRevenue from Tuition and Fees – Assumptions and Methodology Tuition and Fee Assumptions General Assumptions • Methodology • In State Benchmarks: • Credit-based programs are benchmarked against current FCS and SUS average tuition and fees excluding distance learning fees • Competency-based programs can be priced at 60% of credit based program tuition due to lower system costs • Out-Of-State Benchmarks: • Credit-based programs are priced at competitive market prices implying ~30% profit margins • Competency-based programs can be priced at 60% of credit based program tuition due to lower system costs In-State Tuition and Fees Out-of-State Tuition and Fees • Note: Tuition and Fee levels are a policy decision; This is one potential scenario based on practices across the nation observed by ParthenonSource: SUS Board of Governors; FL DOE; ~85+ Institution and expert interviews were conducted by Parthenon for the Florida engagement as well as multiple proprietary projects, from July – November 2012
Strategy DetailRevenue from Tuition and Fees – Total Projections Total Revenue from Tuition and Fees by Strategy, 10 Year Forecast • Note: Tuition and Fee levels are a policy decision; This is one potential scenario based on practices across the nation observed by ParthenonSource: SUS Board of Governors; FL DOE; ~85+ Institution and expert interviews were conducted by Parthenon for the Florida engagement as well as multiple proprietary projects, from July – November 2012
Strategy DetailExpenditure per Completion Summary 1 2 3 4 • Institution by Institution • Institutional Collaboration • Lead Institution(s) • New Online Institution • Total Completions • (Over 10 Years) Total Expenditure(Over 10 Years) Expenditure Per Completion = Expenditure per Credit x (Credits Needed / Graduation Rate) Example • Expenditure per BA • Credit (Year 10) • Graduation Rate(Year 10)) • Expenditure per BA • Completion (Year 10) Note: Expenditure per credit is calculated by dividing expenditure per FTE by 30 credits; Expenditure per completion assumes students are enrolling with 40 credits and need 120 to completes; Expenditures include instruction, academic support, student support, and institutional support expenditures
Strategy DetailExpenditure per Completion in Year 10 By Degree Level : Note: Expenditure per credit is calculated by dividing expenditure per FTE by 30 credits; Undergraduate Certificate programs are assumed to be 18 credits in this example, Associate’s programs are assumed to be 64 credits, Bachelor’s programs are assumed to be 120 credits, Master’s programs are assumed to be 36 credits; Students are assumed to enter with 20 credits for Associate’s programs and 40 credits for Bachelor’s programs; see page 25-25 in summary materials for graduation rate assumptions
Detailed Fact Base Strategy Detail National Post-Secondary Online Market Examples of Innovative Models Florida Persistence Florida Online Enrollments Florida Online Programs Florida Tuition and Fees Florida Employment Florida Virtual Campus Accreditation Detail Stakeholder Interviews
National Post-Secondary Online MarketPost-Secondary Online Enrollments National Post-Secondary Online Enrollments, 2010-2011 Percent of Nationwide Students Taking at Least One Course Online, 2002-2010 Online University vs. Traditional Community College Graduation Rates Note: Students taking at least one online class is defined as students taking at least one course where 80% or more of the content is delivered online Source: Babson Survey Research Group; Deutsche Bank; Eduventures Online Higher Education Update 2011
National Post-Secondary Online MarketPrimarily Online Institution Enrollments Post-Secondary Enrollments in Large Primarily Online Institutions, 2010-2011 For-Profit Non-Profit Note: Percent of master’s enrollments is estimated by adjusting completions by degree type by average program length and applying these shares to top line enrollment figures from IPEDs Source: Deutsche Bank; IPEDS; College Board Completion Arch
National Post-Secondary Online MarketRepresentative Sample: Distance Learning Programs by Level and Program Area, 2010-2011 Representative Sample: Distance Learning Programs by Level and Program Area, 2010-2011 Note: A subset of these programs are hybridsSource: Peterson’s database
National Post-Secondary Online MarketSpectrum of Models Spectrum of Disruptive Innovation Fully Onsite(Traditional Class) Hybrid Traditional Online Self-Paced Online Competency Based Learning Prior Learning(Credit by Portfolio or Exam) MOOCs High Low Source: School websites
National Post-Secondary Online MarketExpenditures per Non-Profit FTE: Primarily Online Institutions Institution Expenditure per Non-Profit FTE, 2010-2011 Primarily Online Institutions Non-research faculty and larger class sizes reduce UMUC’s instructional expenses. This is offset by increased spending on student services such as 24/7 call center SNHU invests heavily in support services and marketing to drive enrollments in new online programs WGU’s competency-based model replaces traditional faculty with student mentors and minimizes all costs with the explicit purpose of reducing the cost of education for students Note: Excludes Research, Public Service, and Other expenditures; Excludes Thomas Edison because of lack of data on IPEDS Source: IPEDS; Deutsche Bank; ~85+ Institution and expert interviews were conducted by Parthenon for the Florida engagement as well as multiple proprietary projects, from July – November 2012
National Post-Secondary Online MarketParthenon August 2012 Post-Secondary Online Student Survey Source: Parthenon Higher Education Survey (n=1,057) Q: In which of the following programs are you currently enrolled?
National Post-Secondary Online MarketParthenon August 2012 Post-Secondary Online Student Survey Note: “Selective” and “Inclusive” categorizations are from IPEDS definitions based on analysis of first-year students’ test scores Source: Parthenon Higher Education Survey (n=1,057) Unduplicated Headcount, Enrollment by Institution Type, 2011
National Post-Secondary Online MarketParthenon August 2012 Post-Secondary Online Student Survey Age Demographic of Respondents Income of Respondents Source: Parthenon Higher Education Survey (n=1,057)
National Post-Secondary Online MarketParthenon August 2012 Post-Secondary Online Student Survey Source: Parthenon Higher Education Survey (n=1,057)
National Post-Secondary Online MarketParthenon August 2012 Post-Secondary Online Student Survey Q: When you applied to college, how many other schools did you apply to? Q: Which of the following describes how you made the decision about what school to attend? Source: Parthenon Higher Education Survey (n=1,057)
National Post-Secondary Online MarketParthenon August 2012 Post-Secondary Online Student Survey Q: How likely would you be to recommend your school to a friend or colleague? (Net Promoter Score) Non-Profit Responses For-Profit Responses Source: Parthenon Higher Education Survey (n=1,057)
Detailed Fact Base Strategy Detail National Post-Secondary Online Market Examples of Innovative Models Florida Persistence Florida Online Enrollments Florida Online Programs Florida Tuition and Fees Florida Employment Florida Virtual Campus Accreditation Detail Stakeholder Interviews
Innovative Post-Secondary Online InstitutionsUMUC – Example of an institution that transformed its offerings into primarily online • Note: *Portfolio: a description of “college-level learning” (obtained through jobs, volunteering, etc.) and a collection of verifying documents • Source: School website; ~85+ Institution and expert interviews were conducted by Parthenon for the Florida engagement as well as multiple proprietary projects, from July – November 2012
Innovative Post-Secondary Online InstitutionsRio Salado – Example of a community college that transformed its offerings into primarily online Source: School website
Innovative Post-Secondary Online InstitutionsSNHU – Example of a university that transformed its offerings into primarily online Source: School website; ~85+ Institution and expert interviews were conducted by Parthenon for the Florida engagement as well as multiple proprietary projects, from July – November 2012
Innovative Post-Secondary Online InstitutionsWGU – Example of a new online institution offering competency based programs Source: School website; ~85+ Institution and expert interviews were conducted by Parthenon for the Florida engagement as well as multiple proprietary projects, from July – November 2012
Innovative Post-Secondary Online InstitutionsNorthern Arizona University – Example of an institution developing competency-based learning Source: School website; ~85+ Institution and expert interviews were conducted by Parthenon for the Florida engagement as well as multiple proprietary projects, from July – November 2012
Innovative Post-Secondary Online InstitutionsASU – Example of partnership model Source: School website; ~85+ Institution and expert interviews were conducted by Parthenon for the Florida engagement as well as multiple proprietary projects, from July – November 2012
Innovative Post-Secondary Online InstitutionsKCTCS – Example of a Collaborative Model (p1) Source: School website; ~85+ Institution and expert interviews were conducted by Parthenon for the Florida engagement as well as multiple proprietary projects, from July – November 2012
Innovative Post-Secondary Online InstitutionsKCTCS – Example of a Collaborative Model (p2) Source: School website; ~85+ Institution and expert interviews were conducted by Parthenon for the Florida engagement as well as multiple proprietary projects, from July – November 2012
Innovative Post-Secondary Online InstitutionsWICHE ICE – Example of a Collaborative Model across states / institutions (p1) Source: Organization website; ~85+ Institution and expert interviews were conducted by Parthenon for the Florida engagement as well as multiple proprietary projects, from July – November 2012
Innovative Post-Secondary Online InstitutionsWICHE ICE – Example of a Collaborative Model across states / institutions (p2) Source: Organization website; ~85+ Institution and expert interviews were conducted by Parthenon for the Florida engagement as well as multiple proprietary projects, from July – November 2012