Download
1 / 28
280 likes | 455 Vues
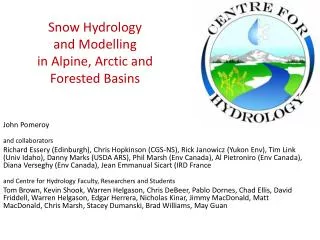
Experience of Modelling Forested Complex Terrain. Peter Stuart, Ian Hunter & Nicola Atkinson 30 th October 2009. Overview. The Challenges of Forested Complex Terrain. Predicting the Breakdown of Linear Flow Models in Forested Complex Terrain. Tuning Canopy Model Parameters

E N D
Experience of Modelling Forested Complex Terrain Peter Stuart, Ian Hunter & Nicola Atkinson 30th October 2009
Overview • The Challenges of Forested Complex Terrain. • Predicting the Breakdown of Linear Flow Models in Forested Complex Terrain. • Tuning Canopy Model Parameters • Energy Yield Prediction Verification in Forested Complex Terrain • Future challenges: Modelling Non-Neutral Canopy Flow
The Challenges of Forested Complex Terrain – Some Observations However masts A,B,C & D are all on the same wind farm site! Masts A & B are in simple non forested terrain Masts C & D are in complex forested terrain 8%
Predicting the Breakdown of Linear Flow Models in Forested Complex Terrain
Predicting the Breakdown of Linear Models in Forested Terrain: Method & Models • Calculate flow over idealised hills using both CFD and linear models for incrementally increasing slopes and tree heights. MS3DJH / RES Roughness Linear CFD • Establish guidelines for where linear models fail by comparing to CFD. • Use simple geometrical considerations to assess likely impact on real sites. • Confirm predicted effects using CFD.
Variation of Critical Terrain Slope with Tree Height (2D Symmetric Hill) Critical angle for recirculation reduced by ~ ¼° per metre of tree height. c.f. Kaimal and Finnigan (1994): 2D Critical slope ~10° for a very rough hill.
Variation of Critical Terrain Slope with Tree Height (2D Symmetric Hill) Critical angle for linear model break down reduced by ~½° per metre of tree height.
Predicting the Breakdown of Linear Models in Forested Terrain: Example Site
Predicting the breakdown of linear flow models in forested terrain: Example Site • Establish critical angle considering tree height (20m). Predominant wind direction 11
Ventos Canopy Model The drag due to the canopy is taken into account via an additional term entering the momentum equation : α (in m2m-3) is the leaf foliage area per unit of volume CD is the canopy drag coefficient. The effects of the canopy on turbulence are accounted for by additional source terms Sk and Sε in the transport equations of k and ε Lopes da Costa, J. C. P., “Atmospheric Flow Over Forested and Non-Forested Complex Terrain”,PhD Thesis University of Porto, July 2007.
Tuning Canopy Parameters: Example site • European site with complex orography and extensive forest cover (H ~ 15m). • 6 meteorological masts used for validation.
Tuning Canopy Parameters: Example site H = 15m, CD = 0.25 and α = 0.2 Measured Shear CFD Predicted Shear 0.80 0.70 0.60 0.50 Shear Exponent 0.40 0.30 0.20 0.10 0.00 M273 M272 M223 M1 M187 M186 Predicted and measured shear exponents for 330° direction.
Tuning Canopy Parameters: Example site Measured Shear Measured Shear CFD Predicted Shear CFD Predicted Shear 0.80 0.80 0.70 0.70 0.60 0.60 0.50 0.50 Shear Exponent Shear Exponent 0.40 0.40 0.30 0.30 0.20 0.20 0.10 0.10 0.00 0.00 M273 M272 M223 M187 M186 M273 M272 M223 M1 M187 M186 M1 2nd Iteration: α→ 0.13 3rd Iteration: α → 0.05 Reducing the canopy density improves agreement, but even with α = 0.05 the predicted shear exponents are still too high.
Tuning Canopy Parameters: Example site Measured Shear CFD Predicted Shear 0.80 0.70 0.60 0.50 Shear Exponent 0.40 0.30 0.20 0.10 0.00 M273 M272 M223 M1 M187 M186 Predicted and measured shear exponents for 330° direction. Further improvement gained by using an effective tree height of ¾ the actual height. Final parameters: H = 11.25m, CD = 0.25, α = 0.05
Tuning Canopy Parameters: Example site Measured Shear CFD Predicted Shear 0.80 0.70 0.60 0.50 Shear Exponent 0.40 0.30 0.20 0.10 0.00 M273 M272 M223 M1 M187 M186 Predicted and measured shear exponents for 300° direction. Optimized parameters derived from 330° direction applied to 300° direction.
Energy Yield Prediction Verification in Forested Complex Terrain
Prediction Verification in Forested Complex Terrain - Site Overview • Moderately complex terrain. 11 multi-megawatt class turbines. • Inhomogeneous forest cover 5-20m in height. • Two 40m Masts (turbine hub height is 65m, rotor diameter is 82m) Mast A Mast B Power Performance Mast T3
How is the Wind Farm Performing? Power performance indicates that turbine T3 is operating as expected. However, the majority of turbines are found to be under producing.
Prediction Verification in Forested Complex Terrain – Terrain Effect • Plot error in yield vs. predicted terrain effect • Strong correlation between predicted terrain effect and error in energy yield. • Using WAsP provides very similar results.
Prediction Verification in Forested Complex Terrain – Increased Roughness • Increasing roughness in orography model improves agreement. • Roughness increased from default 0.04m to 2m, potentially more representative of the site (tree height up to 20m). • Site also modelled using CFD, including a canopy model. • CFD and increased roughness orography model in very close agreement.
Prediction Verification in Forested Complex Terrain – Shear Predictions • Still an error in the predictions; other causes – high shear? Power Performance Turbine Increasing Shear • Strong correlation between high shear and error in energy yield predictions.
Future challenges: Modelling Non-Neutral Canopy Flow • How does non-neutral atmospheric stability change canopy flows e.g. Internal Boundary Layer:
Conclusions • Trees can cause very different site conditions to occur within the same wind farm e.g. 8% change in turbulence intensity. • Tree height has a strong impact on the critical slope at which linear models breakdown. • Tuning of canopy parameters help improve agreement between observations and CFD model predictions. • Operational data suggests that tuning the roughness length in the linear orography model helps improve agreement with operational data and CFD predictions. • Operational data suggests a link between turbine under performance and wind shear.