Introduction : Time-Frequency Analysis
Introduction : Time-Frequency Analysis. HHT, Wigner-Ville and Wavelet. Motivations. The frequency and energy level of data from real world phenomena are seldom constant. For example our speech, music, weather and climate are highly variable. Traditional frequency analysis is inadequate.

Introduction : Time-Frequency Analysis
E N D
Presentation Transcript
Introduction : Time-Frequency Analysis HHT, Wigner-Ville and Wavelet
Motivations • The frequency and energy level of data from real world phenomena are seldom constant. For example our speech, music, weather and climate are highly variable. • Traditional frequency analysis is inadequate. • To describe such phenomena and understand the underlying mechanisms we need the detailed time frequency analysis. • What is Time-Frequency Analysis?
Traditional Methodsfor Time Series Analysis • Various probability distributions • Spectral analysis and Spectrogram • Wavelet Analysis • Wigner-Ville Distributions • Empirical Orthogonal Functions aka Singular Spectral Analysis
Time-Frequency Analysis • All time-frequency-energy representations should be classified as time-frequency analysis; thus, wavelet, Wigner-Ville Distribution and spectrogram should all be included. • Almost by default, the term, ‘time-frequency analysis’, was monopolized by the Wagner-Ville distribution.
Conditions for Time-Frequency Analysis • To have a valid time-frequency representation, we have to have frequency and energy functions varying with time. • Therefore, the frequency and energy functions should have instantaneous values. • Ideally, separated event should not influence each other and be treated independently.
Wigner-Ville Distribution Wigner-Ville Distribution, W(ω, t), is defined as WV Distribution has to be identical to the Fourier Power spectrum; therefore, the mean of Wigner-Ville Spectrum is the same as the Fourier spectrum, | S(ω) |2.
VW Instantaneous Frequency Therefore, at any given time, there is only one instantaneous frequency value. What if there are two independent components? In this case, VW gives the weighted mean.
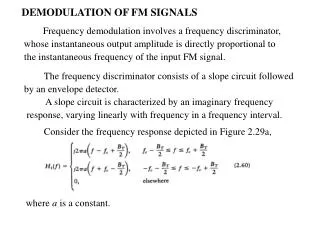
Spectrogram : Short-Time-Fourier Transform Spectrogram is defined as Note 1. G(t, Δt) is a window with zero value outside the duration of Δt. Note 2. The spectrogram represents power density.
Non-addativity of Power Spectral Properties Therefore, for Wigner-Ville Distribution, it is impossible to have two events occur at different time independently with different frequency to be totally independent of each other. Both Wavelet and Spectrogram can separate events. But, Sum of Spectrogram is not the Fourier Spectrum.
Marginal Requirement • Discrete Wavelet analysis with orthogonal basis should satisfy this requirement; Continuous Wavelet with redundancy and leakage would not satisfy this requirement. • As the Wigner-Ville distributions have the marginal distribution identical to that of Power Spectral Density, there is the extra requirement that the marginal spectrum has to be PSD. • A genuine instantaneous frequency distribution will also not satisfy this requirement. • Spectrogram does not satisfy this requirement, for it suffers the poor frequency resolution due to the limitation of the window length. • This is not a very reasonable requirement. If PSD is inadequate to begin with, why should it be used as a standard?
Non-addativity Example : Wigner-Ville Spectrum and Components
Non-addativity Example : Hilbert,Wigner-Ville & Wavelet Spectra
Non-addativity Example : Marginal Hilbert and Fourier Spectra
Non-addativity Example : Marginal Hilbert and Fourier Spectra Details
Summary • Wavelet, Spectrogram and HHT can all separate simultaneous events with different degrees of fidelity, but WV cannot. • The instantaneous frequency defined by moments in WV is crude illogical; it gives only one weighted mean IF value at any given time. • Though WV satisfies the marginal energy requirement, it does not give WV any advantage in time-frequency analysis.