Exploring the Evolutionary Role of Introns in Protein Families
350 likes | 377 Vues
Dive into the fascinating world of introns, their presence in early and late genes, and their potential impact on the evolution of protein families. Learn about self-splicing RNA, exon shuffling, and the intricate relationship between introns and organismal evolutionary history. Explore how introns may have influenced the maturation of the adaptive immune system in vertebrates and the possible selection preferences shaping their distribution. Discover the importance of introns in the context of catalytic RNA and the intricate web of molecular evolution they represent.

Exploring the Evolutionary Role of Introns in Protein Families
E N D
Presentation Transcript
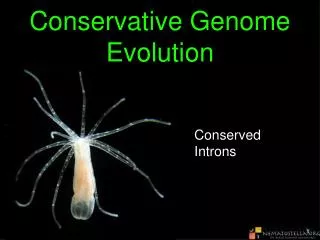
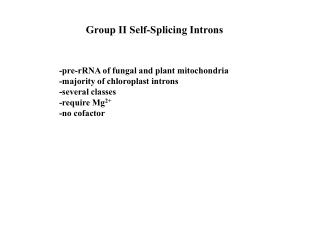
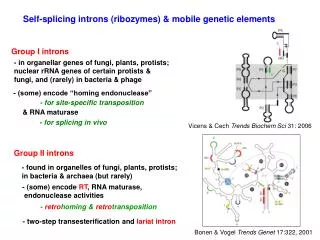
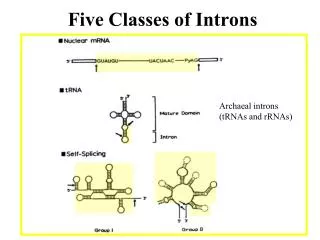
Introns early Introns late • Self splicing RNA are an example for catalytic RNA that could have been present in RNA world. • There is little reason to assume that the RNA world was not plagued by self-splicing parasites. • Neighboring Introns are more frequently in same phase than expected by chance • Spliceosomal introns are present in deep branching eukaryotes • Introns frequently are found in linker regions • Exon shuffling can create a large number of different catalytic sites (see the maturation of the immune system) • Mapping individual introns onto organismal evolutionary history shows that many introns inserted into the sites where they are found presently more recently. • Intron preference for linker region could be the result of selection (they do less harm here than in tightly packed domains. • Exon shuffling in the maturation of the adaptive immune system is a modern trait of vertebrates. • Even if introns are ancient, this does not prove that they played a role in assembling the now existing protein families.
2 7 4 5 6 3 8 1 2 5 6 7 8 1 3
5 6 4 3 7 2 8 1
ATPase dataset from last Friday Alignment clustal vs muscle Conserved part are aligned reproducibly
ATPase dataset from last Friday Alignment vs clustal muscle The alignment of the less conserved parts is questionable. Using the progressive alignment approach on these sequences can cause problems in downstream analyses.
ATPase dataset from last Friday Alignment PRANK vs muscle Conserved part are aligned reproducibly; PRANK has more gaps, and more matches in pairwise alignments.
ATPase dataset from last Friday Seaview -> muscle alignment -> GBLOCKS The LAGLIDADG motifs of the homing endonuclease domains are part of conserved blocks
ATPase dataset from last Friday Sieview: mase format saves site groups Selected sites and sequences can be analyzed separately.
[Alpha: 0.244036] [Alpha: 1.195411] Tree from Extein Muscle Tree from InteinMuscle Tree from InteinPRANK
ATPase dataset from last Friday Reliably aligned positions determined with guidance
ATPase dataset from last Friday Reliably aligned columns determined with GBLOCKS Problem: If Glocks is used, one looses resolution in subgroups!
Terminology Review • Branches, splits, bipartitions • In a rooted tree: clades (for unrooted trees sometimes the term clann is used) • Mono-, Para-, polyphyletic groups, cladists and a natural taxonomy The term cladogram refers to a strictly bifurcating diagram, where each clade is defined by a common ancestor that only gives rise to members of this clade. I.e., a clade is monophyletic (derived from one ancestor) as opposed to polyphyletic (derived from many ancestors). (Note: you do need to know where the root is!) A clade is recognized and defined by shared derived characters (=synapomorphies). Shared primitive characters (= sympleisiomorphies, aternativie spelling is symplesiomorphies) do not define a clade, but a paraphyletic group. Homoplasies define polyphyletic groups (see in class example drawing ala Hennig). To use these any terms you need to have polarized characters; for most molecular characters you don't know which state is primitive and which is derived (exceptions:....).
homology Two sequences are homologous, if there existed an ancestral molecule in the past that is ancestral to both of the sequences Types of Homology Orthologs: “deepest” bifurcation in molecular tree reflects speciation. These are the molecules people interested in the taxonomic classification of organisms want to study. Paralogs: “deepest” bifurcation in molecular tree reflects gene duplication. The study of paralogs and their distribution in genomes provides clues on the way genomes evolved. Gen and genome duplication have emerged as the most important pathway to molecular innovation, including the evolution of developmental pathways. Xenologs: gene was obtained by organism through horizontal transfer. The classic example for Xenologs are antibiotic resistance genes, but the history of many other molecules also fits into this category: inteins, selfsplicing introns, transposable elements, ion pumps, other transporters, Synologs: genes ended up in one organism through fusion of lineages. The paradigm are genes that were transferred into the eukaryotic cell together with the endosymbionts that evolved into mitochondria and plastids (the -logs are often spelled with "ue" like in orthologues) see Fitch's article in TIG 2000 for more discussion.
What is in a tree? • Trees form molecular data are usually calculated as unrooted trees (at least they should be - if they are not this is usually a mistake). • To root a tree you either can assume a molecular clock (substitutions occur at a constant rate, again this assumption is usually not warranted and needs to be tested), • or you can use an outgroup (i.e. something that you know forms the deepest branch). • For example, to root a phylogeny of birds, you could use the homologous characters from a reptile as outgroup; to find the root in a tree depicting the relations between different human mitochondria, you could use the mitochondria from chimpanzees or from Neanderthals as an outgroup; to root a phylogeny of alpha hemoglobins you could use a beta hemoglobin sequence, or a myoglobin sequence as outgroup. • Trees have a branching pattern (also called the topology), and branch lengths. • Often the branch lengths are ignored in depicting trees (these trees often are referred to as cladograms - note that cladograms should be considered rooted). • You can swap branches attached to a node, and in an unrooted you can depict the tree as rooted in any branch you like without changing the tree.
Test:Which of these trees is different? More tests here
Phylogenetic Reconstruction – Why? • A) Systematic classification of organisms e.g.: Who were the first angiosperms? (i.e. where are the first angiosperms located relative to present day angiosperms?) Where in the tree of life is the last common ancestor located? B) Evolution of molecules e.g.: domain shuffling, reassignment of function, gene duplications, horizontal gene transfer, drug targets, detection of genes that drive evolution of a species/population (e.g. influenca virus) C) Identification of organisms e.g., phylotyping in microbiome samples, origin of genes and viruses (e.g., HIV virus, recent ebola outbreak)
Steps of the phylogenetic analysis Phylogenetic analysis is an inference of evolutionary relationships between organisms. Phylogenetics tries to answer the question “How did groups of organisms come into existence?” Those relationships are usually represented by tree-like diagrams. Note: the equation of biological evolution with a tree like process has limited validity at best.
Distance analyses • calculate pairwise distances • (different distance measures, correction for multiple hits, correction for codon bias) • make distance matrix (table of pairwise corrected distances) • calculate tree from distance matrix • i) using optimality criterion • (e.g.: smallest error between distance matrix • and distances in tree, or use • ii) algorithmic approaches (UPGMA or neighbor joining) Phylogenetic reconstruction - How
Parsimony analyses • find that tree that explains sequence data with minimum number of substitutions • (tree includes hypothesis of sequence at each of the nodes) • Maximum Likelihood analyses • given a model for sequence evolution, find the tree that has the highest probability under this model. • This approach can also be used to successively refine the model. • Bayesian statistics use ML analyses to calculate posterior probabilities for trees, clades and evolutionary parameters. Especially MCMC approaches have become very popular in the last year, because they allow to estimate evolutionary parameters (e.g., which site in a virus protein is under positive selection), without assuming that one actually knows the "true" phylogeny. Phylogenetic reconstruction - How
Else: spectral analyses, like evolutionary parsimony, look only at patterns of substitutions, Another way to categorize methods of phylogenetic reconstruction is to ask if they are using an optimality criterion (e.g.: smallest error between distance matrix and distances in tree, least number of steps, highest probability), or algorithmic approaches (UPGMA or neighbor joining) Packages and programs available: PHYLIP, phyml, MrBayes, Tree-Puzzle, PAUP*, clustalw, raxml, PhyloGenie, HyPhy
Bootstrap ? • See here
Elliot Sober’s Gremlins Observation: Loud noise in the attic ? Hypothesis: gremlins in the attic playing bowling Likelihood = P(noise|gremlins in the attic) P(gremlins in the attic|noise) ? ?
P(data|model, I) P(model|data, I) = P(model, I) P(data,I) Likelihood describes how well the model predicts the data Bayes’ Theorem Posterior Probability represents the degree to which we believe a given model accurately describes the situation given the available data and all of our prior information I Prior Probability describes the degree to which we believe the model accurately describes reality based on all of our prior information. Normalizing constant Reverend Thomas Bayes (1702-1761)
Li pi= L1+L2+L3 Ni pi Ntotal Alternative Approaches to Estimate Posterior Probabilities Bayesian Posterior Probability Mapping with MrBayes(Huelsenbeck and Ronquist, 2001) Problem: Strimmer’s formula only considers 3 trees (those that maximize the likelihood for the three topologies) Solution: Exploration of the tree space by sampling trees using a biased random walk (Implemented in MrBayes program) Trees with higher likelihoods will be sampled more often ,where Ni - number of sampled trees of topology i, i=1,2,3 Ntotal – total number of sampled trees (has to be large)
Illustration of a biased random walk Image generated with Paul Lewis's MCRobot Figure generated using MCRobot program (Paul Lewis, 2001)
Likelihood estimates do not take prior information into consideration: e.g., if the result of three coin tosses is 3 times head, then the likelihood estimate for the frequency of having a head is 1 (3 out of 3 events) and the estimate for the frequency of having a head is zero. The probability that both events (A and B) occur Both sides expressed as conditional probability If A is the model and B is the data, thenP(B|A) is the likelihood of model A P(A|B) is the posterior probability of the model given the data. P(A) is the considered the prior probability of the model.P(B) often is treated as a normalizing constant.
Why could a gene tree be different from the species tree? • Lack of resolution • Lineage sorting • Gene duplications/gene loss (paralogs/orthologs) • Gene transfer • Systematic artifacts (e.g., compositional bias and long branch attraction)
Trees – what might they mean? Calculating a tree is comparatively easy, figuring out what it might mean is much more difficult. If this is the true organismal tree: species A species B species C species D what could be the reason for obtaining this gene tree: seq. from A seq. from D seq. from C seq. from B
e.g., 60% bootstrap support for bipartition (AD)(CB) lack of resolution seq. from A seq. from D seq. from C seq. from B
the two longest branches join together e.g., 100% bootstrap support for bipartition (AD)(CB) long branch attraction artifact seq. from A seq. from D seq. from C seq. from B What could you do to investigate if this is a possible explanation? use only slow positions, use an algorithm that corrects for ASRV
Gene Transfer molecular tree: seq. from A seq. from D seq. from C seq. from B speciation genetransfer Gene transfer Organismal tree: species A species B species C species D
molecular tree: seq. from A seq. from D seq. from C seq. from B Lineage Sorting Organismal tree: species A species B species C Genes diverge and coexist in the organismal lineage species D Note: these are NOT paralogs, but different alleles coexisting in the same population
molecular tree: molecular tree: seq. from A seq. from A seq. from A seq. from B seq. from B seq. from C seq. from C seq. from D seq. from D seq. from D seq.’ from B seq.’ from B seq.’ from B seq.’ from C seq.’ from C seq.’ from C gene duplication gene duplication gene duplication seq.’ from D seq.’ from D Gene duplication Organismal tree: species A species B species C gene duplication species D molecular tree:
Gene duplication and gene transfer are equivalent explanations. The more relatives of C are found that do not have the blue type of gene, the less likely is the duplication loss scenario Ancient duplication followed by gene loss Horizontal or lateral Gene Note that scenario B involves many more individual events than A 1 HGT with orthologous replacement 1 gene duplication followed by 4 independent gene loss events
Function, ortho- and paralogy molecular tree: seq. from A seq.’ from B seq.’fromC seq.’ from D gene duplication seq. from B seq. from C seq. from D The presence of the duplication is a taxonomic character (shared derived character in species B C D). The phylogeny suggests that seq’ and seq have similar function, and that this function was important in the evolution of the clade BCD. seq’ in B and seq’in C and D are orthologs and probably have the same function, whereas seq and seq’ in BCD probably have different function (the difference might be in subfunctionalization of functions that seq had in A. – e.g. organ specific expression)