Essential elements of high-performance surface irrigation
Essential elements of high-performance surface irrigation. Tony Oakes, Rubicon Water April 9 2014. Surface Irrigation. Unimproved surface i rrigation. Improved surface i rrigation. Dependant Benefits. On-farm Modernisation Alternatives.

Essential elements of high-performance surface irrigation
E N D
Presentation Transcript
Essential elements of high-performance surface irrigation Tony Oakes, Rubicon Water April 9 2014
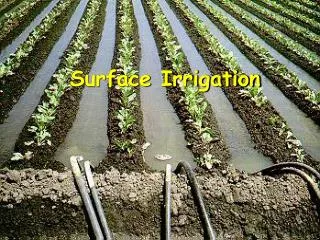
Surface Irrigation Unimproved surface irrigation Improved surface irrigation Dependant Benefits
On-farm Modernisation Alternatives • High-performance surface irrigation is achieving application efficiencies close to that of sprinkler and micro irrigation with considerably less investment and lower carbon foot print Source: Khatri & Smith, University of Southern Queensland
Application Efficiency Unimproved surface irrigation 50 – 70% Application Efficiency Cut-off Point Over Irrigation Under Irrigation Time Varies for each irrigation
Application Efficiency High-performance surface irrigation 85 – 90% Unimproved surface irrigation 50 – 70% Application Efficiency Cut-off Point Over Irrigation Under Irrigation Time Varies for each irrigation
Unimproved Surface Irrigation Multiple days of reduced productivity due to waterlogged conditions Example: low flow – 8 megs per day Low Crop Water Use Efficiency
High-performance surface irrigation Full productive use of water. No evidence of waterlogged conditions Example: high flow – 20 to 22 megs per day High Crop Water Use Efficiency
Key Message • Automation is an essential element of high-performance surface irrigation • Automation ensures on-farm development programs achieve increased application efficiencies • Integrated system of automation and crop management achieves increased productivity using less water
FarmConnect® • FarmConnect is a single platform to deliver the water saving for High-performance surface irrigation via: • control and automation (using iBee radios and Rubicon Actuation and valves), • irrigation system monitoring (pressure, flow, water level, remote pump) • auto detection for cut-off times (using FloodTech) and • sensing plant water demand for irrigation commencement (using soil moisture probes).
FarmConnect® Gateway Fast, reliable communications Cellular Network FarmConnect server Web based viewing Agronomic analysis
FarmConnect® System Internet PPP connection Cellular Network FarmConnect Server Web based viewing Agronomic analysis FarmConnect Gateway BladeValve Multi sensor probes BayDrive
FarmConnect® Integrated solution to automate irrigation Scheduling and control software
FarmConnect® Nodes Integrated solution for remote wireless communicating using telemetry devices • FarmConnect Nodes provides a sensor and actuator interface to the FarmConnect ® system • Nodes self-mesh and self-manage to form a network with optimal data routing with 1 km (0.6 mile) range • GPS receiver provides real-time coordinate information for location-tagging of data • ZigBee • International standard • Open platform • Utilised by Victorian Government for smart metering for water, gas and energy
FarmConnect® Integrated solution to automate irrigation programs • Setup irrigation program • select date and start time • select bay sequence • determine bay runtime • auto calculate total runtime for program • Visually displays bay sequence with bar chart • Spatially displays bay sequence with map • Dispatch program to each radio • Program ready to execute unless updated Event-based automation
FarmConnect® Integrated solution to monitor irrigation programs • Monitor irrigation program in progress • See which bays have completed irrigation • identify current bay still irrigating • determine remaining runtime for current bay • Visually displays bay outlet status: • open (currently irrigating) • closed • stopped (if not completed)
FarmConnect® Integrated solution to manage devices • Manage each bay outlet remotely via mobile deveice: • open • closed • Stopped • Displays bay outlet status • Displays current preset – instruction to open and closed at a certain time and date • Show status of preset: • active or • expired
BayDrive™ Wireless control of bay outlets
BayDrive™ Bay outlet actuation system with furrow irrigation
BladeValve™ Pipe & riser valve actuation system
Smart Meter Gateway • Giving the farmer access to operational data from their meter • Providing connectivity between TCC metering device and Rubicon’s FarmConnect on-farm control system • Full isolation from meter function • No impact on TCC operation (both local and host) or TCC communication system 26
Smart Meter Gateway • Accumulated flow rate is recorded per bay to: • determine volume delivered per irrigation event • determine volume delivered per season • determine volume applied per crop variety • Link water applied to productivity levels: • record productivity (kg or tn) per megalitre • understand water use efficiency on the farm • generate indexes for comparison within farm, season to season or between farms
Smart Meter Gateway • Flow reading used by FarmConnect to achieve high irrigation application efficiencies • Current flow rate • Accumulated flow rate • Determination of time to cut-off • Benchmark each irrigation event • understanding volume applied per bay • Accumulate multiple irrigation events for volume applied per season • Generate indexes for comparison within farm, season to season or between farms • This is expressed as: • irrigation water use index (IWUI) – irrigation only or • gross production water use index (GPWUI) – all water use from irrigation, rain & soil stored • Water order start and stop events used to sequence on-farm automation program
Irrigation Water Use Index • For example with high-performance surface irrigation for maize (dry matter) for a dairy farm, the Irrigation Water Use Index (IWUI) was: • 3.97 ton per megalitre • 27tn per hectare (dry matter – Maize) with 6.8megs per hectare • Compared to traditional surface irrigation for neighbouring dairy farms: • 1.88 ton per megalitre • 16tn per hectare (dry matter – Maize) with 8.5megs per hectare • The capability of high-performance surface irrigation can double the production with the same volume of water and cropped area or • Produce the same level of production with half the water and cropped area 29
FloodTech™ Sensor – Bay Cut-Off • The precise time to stop the flow onto the bay from the bay outlet or riser valve is dynamic as seasonal changes in ground cover or a different soil moisture content changes the runtime • Delivers high-performance surface irrigation • Adds science to the decision to determine the time to shut the bay outlet to avoid tail water losses • Essential requirement to ensure High Flow achieves high water application efficiency • Backed up with alarms to notify operator if exceptions occur • Irrigation is completed without tail water losses incurred
Determination of time to cut-off Point of Full Depth ds di End of bay • Flow rate – measured at Smart Meter Gateway • Advance time and flow depths – measured by FloodTech sensors a location down the bay • Bay geometry – length, width, slope • Soil moisture deficit – from moisture probe or ET estimates t=0 tb tc ta Flow = Q TIME Bay outlet Water front Cut-off point FloodTech sensor location
Application Efficiency Possible efficiency range 85 – 90% Application Efficiency Cut-off Point Over Irrigation Under Irrigation Time Varies for each irrigation
Understanding irrigation management is a key aspect to implementing Improved Surface Irrigation - the result is higher water use efficiency using less water to grow more crop. delay the timing of the next irrigation without reducing crop productivity allow consumptive use of available water at all levels of the root zone while extending the irrigation interval providing a soil profile with increased capacity to accept the next irrigation applied and reduce waterlogging knowledge of the soil moisture deficit and confidence of knowing the number of days till next irrigation event without being to late or too early Crop Water Use Efficiency
FarmConnect® Integrated solution to determine demand management Irrigation Management Concepts • Summed Graph • daily water use rate • irrigation effectiveness • when to irrigate • how much to irrigate • establish upper & lower limits • Separate Layer Graph • through drainage & infiltration rates • where most root activity occurs • soil moisture stress at each layer
FarmConnect® Integrated solution to determine demand management • Prediction of next irrigation • A line extrapolated from the trend of current crop water use, estimating future soil moisture decline • The trend line automatically updates providing the latest trend • Determine when your next irrigation is due (when the trend line intersects the refill point)
FarmConnect® Integrated solution to determine demand management • Device list of soil moisture sites with prediction of next irrigation • Fuel gauge to show range of soil moisture and current status • Quick view of soil moisture graphs on mobile device or tablet (iPhone or Android)
FarmConnect® Integrated solution to determine effective rainfall in soil profile • Overlay rainfall events with the data from the soil moisture probe • Analyse how effective rainfall was within the soil profile
Crop Water Use Efficiency • The following case study highlights the transition from a current schedule to an actual schedule after suggestions were identified for improvement. • The result will be less number of irrigations, less volume of water applied and increased crop productivity 39
Case Study - Historic Schedule • Soil moisture probe captures irrigation events and daily crop water use • Records data for future interpretation
Case Study – Opportunities for improvement Multiple days of reduced productivity due to waterlogged conditions
Case Study – Opportunities for improvement Strong daily water use - soil moisture is still available - no stress evident at this deficit
Case Study - Suggested Schedule Strong daily water use - soil moisture is still available - no stress evident at this deficit Delay irrigation and monitor that continued soil moisture is still available – watching for evidence of any reduction in daily water use • Delay irrigation compared to previous irrigations and monitor that continued soil moisture is still available – watching for evidence of any reduction in daily water use • Ensure that the next irrigation is not too early
Case Study - Suggested Schedule Strong daily water use - soil moisture is still available - no stress evident at this deficit Multiple days of reduced productivity due to waterlogged conditions Delay irrigation and monitor that continued soil moisture is still available – watching for evidence of any reduction in daily water use • Delay irrigation compared to previous irrigations and monitor that continued soil moisture is still available – watching for evidence of any reduction in daily water use • Ensure that the next irrigation is not too early
Case Study - Actual Schedule Short irrigation intervals Longer irrigation intervals Rainfall event occurred and a decision to further delay irrigation was made with confidence Advised the manager to delay Irrigation and monitor that continued soil moisture is still available – watching for evidence of any reduction in daily water use Confirmed the delay in the two Irrigations showed no evidence of any reduction in daily water use Changed practice Original practice • Since the recommendation date, the manager has delayed irrigations to maximise water use in the soil profile without stress or reduction in productivity • The crop has benefited with being able to harvest rainfall within the profile for productive water use
Case Study - Actual Schedule Advised the manager to delay Irrigation and monitor that continued soil moisture is still available – watching for evidence of any reduction in daily water use Original practice Changed practice • Since the recommendation date, the crop has accessed available moisture at lower depths within the soil profile compared to before recommendation • This maximises water use efficiency, reduces waterlogging as profile is fully utilised before refilling
Soil moisture monitoring records events as they happen - in real time – and presents them in an understandable format Predictive tool (pre-planning) Know the effectiveness of rainfall Estimations of yield Auditing of season performance Site specific measurement can be integrated with spatial data from other precision ag technologies (imaging, surveying etc) Learn how the crop responds in the ‘plant – soil – climate’ matrix Aggregation of data (region-wide) can help agronomists understand district trends (influence on strategy) Benefits for Crop Management
Summary • Automation is an essential element of High-Performance Surface Irrigation, ensuring the On-Farm development programs achieve increased application efficiencies by using an integrated system of Automation and Crop Management to achieve increased productivity using less water.