Ion Exchange Laboratory
310 likes | 512 Vues
Ion Exchange Laboratory. Pre-Lab Discussion Outline. Column chromatography Types and principles Focus on: ion exchange chromatography Ion exchange experiment Sample mixture: GFP and cytochrome c Pour column Purification protocol Spetrophotometer For your information slides

Ion Exchange Laboratory
E N D
Presentation Transcript
Pre-Lab Discussion Outline Column chromatography Types and principles Focus on: ion exchange chromatography Ion exchange experiment Sample mixture: GFP and cytochrome c Pour column Purification protocol Spetrophotometer For your information slides Spectrophotometer Standard curve
Types of Column Chromatography Ion Exchange Gel Filtration Affinity
Basis for separation Ion Exchange Gel Filtration Affinity Charge Size Conformation
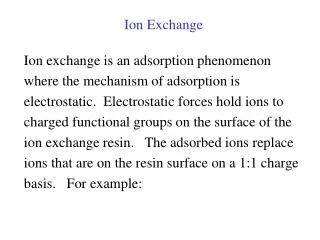
Ion Exchange Chromatography Separates molecules based on charge A solid charged cellulose matrix with a charge is used Solution of different charges are used
Types of Ion Exchangers A cation exchanger An anion exchanger
Today’s Ion Exchange Experiment Objective: to separate two proteins of different charges from a sample mixture using an ANION EXCHANGER and then determine the concentration of one of these proteins using spectrophotometry.
Example of a biomedical application • Let’s say you have a population of cells (tumor + non-tumor) and the tumor cells express an abnormal protein of a different charge (but the same size) as the normal protein. You think this abnormal protein may contribute to tumor growth. • You want to separate these proteins and study them.
Obtain sample mixture of two proteins of different charges Green fluorescent protein(GFP): negatively charged (anionic) chromophores (26.9 kDa) 395 nm (major peak) (NOTE: due to simulated dye product we will use 550 nm)! Cytochrome c: positively (cationic) charge protein (12.4 kD)
GFP 238 amino acids Used to follow gene expression
Cytochrome c Highly conserved heme-protein Associated with inner mitochondrial membrane Participates in electron transport
Overview of your ion exchange experiment: Separate GFP from cytochrome c Add 0.01 M KOAc first First remove (elute) and discard cytochrome c Then add 0.5M KOAc next Remove (elute) and save GFP
Add (0.5 ml) sample mixture (1 mg/ml of starting GFP) to anion exchanger column Sample mixture: cytochrome c positively charged (cationic) and GFP negatively charged (anionic) Beads have a positive charge
0.01 M Potassium Acetate Cytochrome c elutes but GFP remains bound to column How do you remove GFP from the bead?
Now add the: 0.5 M Potassium acetate GFP now elutes Collect sample Measure volume Determine concentration
1st Calibration Empty Zero transmission Pure water 100% transmittance
Next: GFP standard curve using serial dilutions: * Stock GFP is 1 mg/ml BE SURE YOU UNDERSTAND HOW TO PREPARE SERIAL DILUTIONS
Finally measure the GFP collected from the column • Obtain absorbance values for your GFP collected from your column • Use your standard curve to convert absorbance to concentration • Sample mixture contained 0.2mg/ml of GFP. (remember you added 0.5ml of this solution to your column)
Ion exchange worksheet :due date: 9/29 Please hand in a neatly presented: 1. Table with absorbance and corresponding concentration values 2. A graph of your GFP standard curve, be sure to label the axis 3. The concentration of your purified GFP(mg/ml) 4. The total amount of GFP purified (mg) 5. The volume (ml) of your collected (purified) GFP 6. The % recovery = mg GFP purified/total amount GFP (mg) addded x 100 Note: If you diluted your purified GFP remember to use the dilution factor in your calculations
Let’s Begin…. These additional slides are to help you review the principles of spectrophotometry and the use of a standard curve.
Instrumentation: Review Spectrophotometer T A 0 100 plug
Calibration Spectrophotometer Cuvette (requires 4 ml) T A 0 100 plug Set: 100% transmission with cuvette + water Set: 0% transmission without cuvette
What is a standard curve? • A graph that allows a quantitative determination known concentration.
Why do we use standard curves? To obtain quantitative measurements In clinical settings Measurement of blood hormones Measurement of environmental carcinogens Measurement of drugs Measurement of antibodies (such as anti-HIV)
Example of Standard CurveStep 1: Data Collection of Known Values Absorbance 260 nm DNA ug/ml 0.0 0.2 0.4 0.6 0.8 1.0 0.0 0.18 0.35 0.60 0.70 0.95
Step 2. Standard Curve 1.0 .8 .6 .4 Absorbance (260nm) (dependent variable) .2 0 .2 .4 .6 .8 1.0 0 DNA (ug/ml) (independent variable)
Step 3. Use the curve to calculate unknowns 1.0 .8 Unknowns Prostate Tumor DNA Abs. 0.85 Normal Prostate DNA Abs. 0.40 .6 .4 Absorbance (280nm) (dependent variable) .2 = unknown values X X 0 X .2 .4 .6 .8 1.0 0 DNA (ug/ml) (independent variable)
FYI: Ion Exchange Chromatography & pH Generally speaking, a protein will bind to a cation exchange resin if the buffer pH is lower than the isoelectric point (pI) of the protein, and will bind to an anion exchange resin if the pH is higher than the pI.