Chapter 2 Basic Tools for Improving Quality
Chapter 2 Basic Tools for Improving Quality. 7 Basic Tools by Ishikawa. Histogram Pareto chart Scatter plot Control chart Cheek sheet Cause-and-effect diagram Defect concentration diagram. 2.1 Histogram. Table 2.1 Example Data. Histogram by Minitab. Histogram by Excel.


Chapter 2 Basic Tools for Improving Quality
E N D
Presentation Transcript
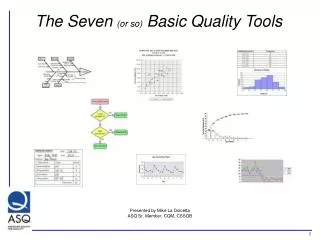
7 Basic Tools by Ishikawa • Histogram • Pareto chart • Scatter plot • Control chart • Cheek sheet • Cause-and-effect diagram • Defect concentration diagram
2.2 Pareto Charts • A Pareto chart is a bar graph that shows the relative frequencies of observations in a descending order. • draws its name from an Italian economist, VilfredoPareto (1848–1923) • J. M. Juran is credited with being the first person to apply it to industrial problems
2.3 Scatter Plots • A scatter plot is another simple graphical device • The simplest type is a bivariate scatter plot, in which two quantities are plotted. • Scaling of the two axes is somewhat arbitrary • A time sequence plot is a type of scatter plot in that data on one variable are plotted against a second variable, time. • A probability plot is another type of scatter plot.
Variations of Scatter Plots • Use number or special symbols for duplicated data points. • Use “range frames”, instead of scales
2.4 Control Charts • A control chart is a time sequence plot with “decision lines” added. • These decision lines are used to try to determine whether or not a process is in control. • Type I and II errors
10 9 1 2 3 4 5 6 7 8 Typical Control Chart Upper control limit 2s 1s Central Line 95% 99.73% 1s Lower control limit -1 -3 -2 =0 1 2 3 2s Sample number
2.5 Check Sheet • A check sheet is a means of recording historical data on causes of nonconformities or nonconforming units. • The general idea is to record all pertinent information relative to nonconformities and nonconforming units, so that the sheets can facilitate process improvement. • Such information might include notes on raw materials, machine performance, or operator changes.
2.6 Cause-and-Effect Diagram • The cause-and-effect diagram was introduced in Japan in 1943 by Professor Kaoru Ishikawa of the University of Tokyo. • For that reason it is sometimes called an Ishikawa diagram; it has also been called a fishbone chart.
2.7 Defect Concentration Diagram • It is simply a schematic diagram that shows the various sides of a unit of production, with the positions where nonconformities occur pinpointed.
2.8 The 7 Newer Tools • Affinity Diagram • Interrelationship Digraph • Tree Diagram • Prioritization Matrix • Matrix Diagram • Process Decision Program Chart • Activity Network Diagram
2.8.1 Affinity Diagram • An affinity diagram is a set of ideas about a particular topic that are grouped into clusters. • The diagram is the end product of brainstorming that is performed in a prescribed manner.
2.8.2 Interrelationship Digraph • An interrelationship digraph is used for identifying and exploring causal relationships between related ideas. • This is a step beyond an affinity diagram, as an interrelationship digraph is a figure with arrows indicating relationships between ideas.
2.8.3 Tree Diagram • A tree diagram is somewhat similar to a cause-and-effect diagram in that a desired effect (e.g., reducing delivery delays) can be shown pictorially as related to the factors that can lead to the effect. • A tree diagram will generally more closely resemble a company organizational chart in appearance than a cause-and-effect diagram. • A tree diagram is a more structured display than either an affinity diagram or an interrelationship digraph.
2.8.4 Prioritization Matrix • A prioritization matrix is a relative ranking of issues jobs, objectives, products, and so on. • The ranking is accomplished by comparing the components pairwise so that a logical and consistent ranking results.
2.8.5 Matrix Diagram • A matrix diagram is used for showing relationships between two or more sets of ideas, projects, and so on. • The matrix can have one of several different forms. • At least five forms have been used: • C-shaped • L-shaped • T-shaped • X-shaped, and • Y-shaped
2.8.6 Process Decision Program Chart • A process decision program chart is a listing of undesirable events and corresponding contingency actions relative to planned actions. • It is used when there is considerable concern about the possibility of negative unanticipated outcomes.
2.8.7 Activity Network Diagram • This is essentially a combination of two well-known techniques: PERT (Program Evaluation and Review) and CPM (Critical Path Method).