Understanding Police Hiring Impacts on Crime Rates in Major US Cities
Explore the correlation between police employment and crime rates in large US cities to uncover the impact of public safety spending. Utilize data from 61 cities to estimate a model and predict trends. Investigate the relationship between police force size and violent crime rates.

Understanding Police Hiring Impacts on Crime Rates in Major US Cities
E N D
Presentation Transcript
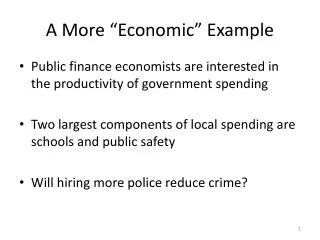
A More “Economic” Example • Public finance economists are interested in the productivity of government spending • Two largest components of local spending are schools and public safety • Will hiring more police reduce crime?
Let y=crime rate (crime per person) • Let x=police employed per person • Interested in estimating the gradient • dy/dxhow will crime change when a city hires more police
Collect data on a cross section of cities • 61 cities with populations in excess of 250K • Estimate basic model Yi = β0 + β1Xi + εi • What do you think is the most frequent sign (+ or -) on police?
Crime Rank 1. Detroit 2. Memphis 3. Baltimore 4. Nashville 5. Philadelphia 6. Washington, DC 7. Boston Rank of Police force size 10 27 6 25 8 1 9 Highest violent crime rates