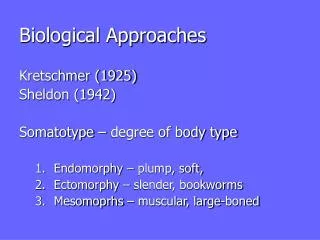
Biological Intelligence
Biological Intelligence. Artificial Intelligence Biological Sensors Cognitive Neuroscience Cognitive Science Neuronal Pattern Analysis. Physiological Saline. MALDI Matrix Solution. Cell. Matrix. Sample Plate. Single Cell and Subcellular MALDI Mass Spectrometry


Biological Intelligence
E N D
Presentation Transcript
Biological Intelligence Artificial Intelligence Biological Sensors Cognitive Neuroscience Cognitive Science Neuronal Pattern Analysis
Physiological Saline MALDI Matrix Solution Cell Matrix Sample Plate Single Cell and Subcellular MALDI Mass Spectrometry for the Direct Assay of the Neuropeptides Neuropeptides and hormones can be directly detected from biological samples ranging in size from femtoliter peptidergic vesicles to large invertebrate neurons. When combined with genetic information, the complete processing of prohormones into biologically active peptides can be measured in a single cell. Current work involves developing mass spectrometric imaging (to determine the precise locations of the peptides) and the ability to measure peptide release from single cells and brain slices.
Narendra Ahuja Bill Greenough William O'Brien Mark Band Steve Boppart Sariel Har-Peled Art Kramer Harris Lewin Zhi-Pei Liang Lei Liu Greg Miller Jean Ponce Jim Zachary Center for Biomedical Computing
Micro Patterned Neuronal Networks in CultureRecent Progress Robustness: Neurons Stay in Patterns for One Month Designability: Neurons Can Be Guided Over Electrodes on a Microelectrode Array Single fibers superimposed on electrodes Patterned fiber track superimposed on electrodes Bruce C. Wheeler, Member of the Neuronal Pattern Analysis and Biosensor Research Groups, Faculty in the Electrical and Computer Engineering Department
40 30 % Active Electrodes 20 10 0 100 200 300 400 500 Local Cell Density (per mm2) Micro Patterned Neuronal Networks in CultureRecent Progress Input/Output: Multiple Channel Electrical Recordings Can be Obtained Routinely Function: Are Neurons in Patterns More Active? A. Patterned Networks Have Greater Activity Without Patterns: 1% ± 3% active electrodes With Patterns: 16% 12% active electrodes B. Activity Increases with Cell Density PatternedNeuron Cultures Bruce C. Wheeler, Member of the Neuronal Pattern Analysis and Biosensor Research Groups, Faculty in the Electrical and Computer Engineering Department
Detection of weak signals in noisy spike trains B) Signal superimposed on noisy spike train A) Signal due to small prey C) Signal superimposed on regular afferent spike train Model of electric fish with electroreceptors distributed over its body. (A) The change in afferent firing activity due to a small prey. (B) the signal due to the prey superimposed on fluctuations due to spontaneous activity, in the case of a standard (binomial) model for afferent firing activity with the same firing rate as the afferent and (C) the signal superimposed on the actual afferent baseline activity. In contrast to (B), the afferent spike train exhibits long-term regularity (memory). This limits the fluctuations in baseline firing rate, making weak signals easier to detect. number of spikes in a 10 ms window with mean subtracted
cre mice loxP mice Production of transgenic mice using cre-loxP technology • Create cell-type specific knockout mice • Two lines of mice required: • cre mice which express cre in desired cells • loxP mice with loxP sites flanking the gene of interest
KO CTL
Dendritic Development in Barrel Cortex Chang and Greenough, 1988
rt ey h g v i Optical Coherence Tomography Fiber-Optic OCT Instrument High-Resolution OCT of Cell Mitosis & Migration Real-Time Endoscopic Imaging Non-Invasive Imaging of Developing Biology
Non-invasive optical imaging • New group of procedures for measuring the optical parameters of the cortex • Scattering and absorption of near-infrared (NIR) photons traveling through tissue • These parameters can be inferred by measuring: • The degree of light attenuation (intensity) • The degree of photon (phase)delay
Assessment of exposed tissue Assessment of deep tissue (UV and visible light) (Near infrared light) Intrinsic Contrast Contrast Agents Contrast Agents Intrinsic Contrast Light Scatter Brain cell swelling during functional activity? FAST NIRS-Signals EROS Absorp- tion [Cytochrome- C-Oxidase] [Oxy-Hb] [Deoxy-Hb] ‘Intrinsic Brain signals’? Fluores- cence [NADH] [oxy- Flaveo- proteins] Light Scatter Brain Cell Swelling during functional activity? ‘Intrinsic Brain signals’? Doppler Shift Blood Flow Blood Volume Blood Cell Velocity LDF Absorp- tion Blood Flow (e.g.Indicator Dilution with Cardiogreen) Fluores- cence Ion-Conc (Ca, K, Mg) Voltage Sensitive Dyes Micro- circulation Fluores- cence Principally feasible, depending on tracer development? Doppler Shift Blood Flow Fluores- cence ? Absorp- tion [Cytochrome- C-Oxidase] [Oxy-Hb] [Deoxy-Hb] NIRS Absorp- tion Blood Flow (Indicator dilution with Cardio- green oxygen) NIRS Optical Methods Modified from A. Villringer
Optical effects • “Slow” effects • develop over several seconds after stimulation • correspond to effects observed with fMRI and PET • are presumably due to hemodynamic changes • “Fast” effects (EROS) • develop within the first 500 ms after stimulation • are most visible on the photon delay parameter • are presumably due to neuronal changes
0 . 0 . 2 0 . 0 - 0 . 2 0 . 2 0 . 0 - 0 . 2 - 0 . 4 - 0 . 6 0 5 1 0 1 5 2 0 2 5 3 0 3 5 4 0 4 5 5 0 5 5 6 0 Hb oxygenation in visual cortex 0 . 6 [oxy-Hb] 4 Concentration changes / microM [deoxy-Hb] Time / s Modified from A. Villringer
[oxy-Hb] vs. CBF [deoxy-Hb] vs. CBF [total-Hb] vs. CBF 12 12 12 CBF (PET) CBF (PET) CBF (PET) -14 -14 -14 -30 -15 -20 15 30 15 oxy-Hb (NIRS) deoxy-Hb (NIRS) total-Hb (NIRS) Comparison of PET and NIRS Modified from A. Villringer
0.5 Water Hb 0.4 AbsorptionCoefficient (cm-1) 0.3 0.2 0.1 HbO2 0.0 600 700 800 900 1000 Wavelength (nm) NIR Absorption Spectra
In-vitro scattering effects Scattering changes during an action potential Scattering changes during tetanic activation of a hippocampal slice voltage scattering
Phase delay measured at 5 kHz Synthesizer Delays (ps) Delays (ps) 1 2 3 Time (s) Stimulus Signal Averaging 112 MHz PMT Optic fiber LED Head surface 200 400 Time (ms) Cerebral cortex Volume described by photons reaching fiber Average Evoked Response EROS: Methods
Neuro-Vascular Relationship • The hemodynamic (NIRS) effect is proportional to the size of the neuronal (EROS) effect integrated over time • This supports the use of hemodynamic brain imaging methods to quantify neuronal activity Gratton, Goodman-Wood, & Fabiani, HBM, in press
fMRI EROS pre-stimulus baseline 100 ms latency 200 ms latency RH LH Upper-left visual stimulation Gratton et al., NeuroImage, 1997
+ Right Visual Field Stimulation Left Hemisphere Response Screen
+ Right Visual Field Stimulation Left Hemisphere Response Screen
+ Right Visual Field Stimulation Left Hemisphere Response Screen
+ Right Visual Field Stimulation Left Hemisphere Response Screen
+ Right Visual Field Stimulation Left Hemisphere Response Screen
+ Right Visual Field Stimulation Left Hemisphere Response Screen
+ Right Visual Field Stimulation Left Hemisphere Response Screen
+ Right Visual Field Stimulation Left Hemisphere Response Screen
+ Right Visual Field Stimulation Left Hemisphere Response Screen
+ Right Visual Field Stimulation Left Hemisphere Response Screen
+ Right Visual Field Stimulation Left Hemisphere Response Screen
+ Right Visual Field Stimulation Left Hemisphere Response Screen
+ Right Visual Field Stimulation Left Hemisphere Response Screen
+ Right Visual Field Stimulation Left Hemisphere Response Screen
+ Right Visual Field Stimulation Left Hemisphere Response Screen
+ Right Visual Field Stimulation Left Hemisphere Response Screen
+ Right Visual Field Stimulation Left Hemisphere Response Screen
+ Right Visual Field Stimulation Left Hemisphere Response Screen