Download
1 / 38
380 likes | 505 Vues
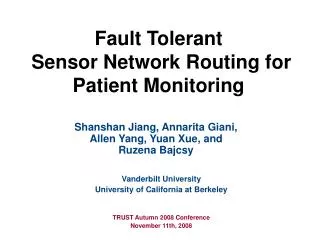
This paper presents a robust solution for detecting sensor faults and patient anomalies using Wireless Body Area Networks (WBAN). With advances in medical procedures and an increasing patient population, reliable real-time monitoring becomes essential. The authors propose using a J48 decision tree and linear regression to identify abnormalities in vital signs, ensuring quick response to potential health issues. The approach is validated through experiments, demonstrating high True Positive Rates while addressing shortcomings in continuous data management and fault tolerance.

E N D
Sensor Fault and Patient Anomaly Detection Osman Salem, Alexey Guerassimov, and Ahmed Mehaoua University of Paris Descartes – LIPADE Division of ITCE, POSTECH, Korea Anthony Marcus and BorkoFurht, Department of Computer and Electrical Engineering and Computer Science, Florida Atlantic University Jonathan David 2013 IEEE International Conference onCommunications, pp.4373,4378, 9-13 June 2013
The Need for Improvement • Average lifetime has increased • Advancement in medical procedures • Technological advances • Increased knowledge base • Unfortunate problem: Its hard to care for everyone! • Increase in average lifetimes means an increase in the population • Shortage of healthcare professionals
The Solution • Wireless Body Area Networks (WBAN) • Network of wireless sensors to relay patient information • Uses accurate, high-throughput networks • Allows patient greater freedom and mobility
What can be measured? • Heart rate • Pulse • Oxygen saturation • Body Temperature • Respiration Rate • Blood Pressure • Blood Glucose • Galvanic Skin Response It is quite comprehensive!
How does it work? • Networked sensors transmit to central device • Can be patients cell phone, base station in house, etc. • Handles processing and storage • Sends alarm upon detection of anomaly • Used on patients with chronic illnesses • Can be used to monitor patient recovery after surgical procedures
Are there any problems?Are there ever not any?The sad truth of engineering
Problems • Faulty measurements • Hardware failures • Security issues • Sensors have limits • Reduced computational power • Limited storage capacity • Limited energy resources • Passed to central device for processing
Detect Faulty Measurements • Focus on what is correctible: bad readings • A faulty reading can mean an error or that a patient is entering a critical state • The differences are distinguished using historical data • Achieved using an anomaly detection mechanism • Suitable for WSNs given the lack of attack signatures • Patterns checked against dynamically updated normal model • Unfortunately, in the training phase it is difficult to find normal data to establish a normal profile
How does the paper tackle this? • Use a J48 decision tree to detect abnormalities • Apply linear regression to find abnormal measurements in an abnormal record
Decision Tree J48 • Implementation of C4.5 decision tree • Classifies record and reduces temporal complexity • Attributes are stored in non-terminal nodes • Terminal nodes represent an outcome • An algorithm is used to obtain the gain ratio of each attribute, which allows for hierarchical distribution among the tree nodes
Linear Regression • Predicts the current measurement for each parameter • Sends a trigger when current value is greater than the predicted value by a certain threshold • Correlation analysis conducted to detect faults
Why use this approach? • The purpose is to detect abnormal patterns • Process needs to be real-time and must be fast • Uses data passed to central device for processing • Sensors don’t have the processing power or storage for this • J48 used because it is efficient at classification • Easier to sort through large chunks of data • Quicker identification of data that contains anomalies • Linear regression determines if it is an error • If one anomaly, the value is replaced by predicted value • It two anomalies, medical teams are alerted
How well does it work? • Results focused on five vital signs • Heart rate ϵ [80 – 120] • Pulse ϵ [80 – 120] • Respiration Rate ϵ [12 – 30] • SpO2 (Oxygen Saturation) ϵ [90 – 100] • Body Temp ϵ [36.5 – 37.5] • Based on two phases • Training • Machine learning methods used create model for data • Detection • Inputs classified as abnormal if they deviate from the model
Results • Anomalies can be seen at approximately times .7 and 2.4 • Two alarms are raised • At .7, alarm due to abnormal pulse AND SpO2 • At 2.4, alarm due to highly irregular heart rate
Results • Figure 5 uses methods proposed in paper • Figure 6 uses k-NN (k Nearest Neighbors) • More computationally expensive • Higher error than additive regression • Figure 7 uses a decision table • Produces the worst results in all cases
Results • Linear regression has lowest mean error • Approach achieves a high True Positive Rate with a corresponding low False Positive Rate
Shortfalls of the Study • Does not mention what happens when data is continuously read as faulty • May be indication of underlying health problem • Indication that sensor needs to be replaced • Learning phase is glossed over • Does it learn when patient is doing physical activity? • How long is the learning phase? • Paper could use more fault tolerant methods • Readings of same type from multiple sensors (TMR)
Conclusions • The approach used in the paper performs well • High True Positive rate • Low False Positive rate • Supposedly less computational power than other approaches • Supposedly less storage used • Some areas of the study remain dubious • Power comparisons? • Computation time? • Detection and replacement of faulty sensors?
Architecture Design of Mobile Access WSNs Mai Abdelhakim, Leonard E. Lightfoot, Jian Ren, Tongtong Li Department of Electrical & Computer Engineering, Michigan State University Air Force Research Laboratory, Wright-Patterson Air Force Base Jonathan David 2013 IEEE International Conference onCommunications, pp.1720,1724, 9-13 June 2013
The Need for Improvement • WSNs impact on military and civilian applications • Need efficient and reliable communication over large-scale networks • Energy constraints • Trade-off between efficiency and throughput • SENMA (sensor networks with mobile access points) • Mobile access units traverse network to collect data • Improves energy efficiency of the sensors • Improvement in terms of energy over ad-hoc • Sensors do not perform energy-consuming routing functions • Unfortunately, there is a large delay in data collection
The Solution • Use mobile access coordinated wireless sensor networks (MC-WSN)! • Energy efficient, reliable, allows time-sensitive info • Network is divided into cells • Each cell is covered by one MA • MA deploys, recharges, and replaces nodes • Also replaces compromised nodes (enhanced security) • Data is sent to a cluster head in each cell • Cluster head is always located at center of cell • Easy data gathering (location is known, easy to find)
Improvement over SENMA • Number of hops from any sensor to the MA is minimized to pre-specified number • Set by network deployment and design topology • Delay is not based on speed of the MA! • Only based on number of hops and wave speed • Energy consumption is also improved • Determined by MA distance from nearest cluster head • Independent of MA coverage area and node density Higher energy efficiency, lower delay times!
Design of the Cells • Hexoganalcells • Each cell has one MA • Sensor nodes deployed, each group with a cluster head • One powerful center cluster head • Center cluster head communicates with the MA
The Mobile Access Point • UAV capable of land travel • Multiple duties • Deploys • Replaces • Recharges • Collects data • Returns collected data to a base station • Only moves for data collection if routing path fails • Communication with main cluster head and the nearest cluster head
Main Features of MC-WSN • Resolves network deployment and extend lifetime • MAs manage deployment of sensors and CHs • Node signals MA when it is low on energy • Minimizes delay times • Speed dependent on number of hops and wave speed • MAs determine the topology of the network • Provide high energy efficiency • Sensor nodes communicate to nearest cluster heads • No inter-cluster routing necessary
Main Features of MC-WSN • Enhanced network security • Compromised sensors and cluster heads are replaced • The MA itself roams the cell, keeping its location private • Enhanced resilience, reliability, and scalability • Self-healing architecture • Health relayed to MA by the central cluster head and/or nearest cluster head • If routing paths fail, MA can roam cell to collect data
Creating the Network • Form clusters • CHs broadcast Hello message with ID and location • Each sensor connects to nearest CH • Ring set-up (boundary) • MA traverses the cell, broadcasts Start message to CHs • MA denotes the cluster heads along its ring path • Discover links to ring • CHs broadcast a message to find neighboring CHs • Continues until all CHs find at least one neighbor
Creating the Network • Discover links to the central cluster head • CCHs broadcasts a signal to find neighboring CHs • The signal is forwarded by the CHs until it reaches CHs on the ring • Establish links to the ring or central cluster head • Cluster heads establish connections with the central cluster head or the closest cluster head • The process is completed when the receiver successfully confirms a connection
Data Gathering • Periodical sensing and collecting stages • Sensors report information to the cluster heads • Cluster heads report to other cluster heads or CCH • Transmission interference is avoided • Sensors report in a given time slot • Nodes of different clusters use different spreading codes • Transmissions from sensors to CHs, between CHs, from CHs to the MA, and from the CCH to the MA all use different frequency ranges • MA sends a beacon signal, allowing CHs to communicate with it
Results • Ring and CCH method produces lower average number of hops • Energy used by MC-WSN setup is orders of magnitude lower than SENMA setup
Shortfalls of the Study • What happens if the MA fails? • Data seems to only flow into the MA from CCH and the CHs, no check ups are performed on the MA • How much energy is needed to run the MA? • How practical is the MA? • Is it feasible with todays technology? • Complicated machinery • Seems to be very expensive • Is the energy saved by the network worth the cost of running the MA?
Conclusions • MC-WSN provides multiple improvements over SENMA • Huge reduction in energy consumptions • Massive decrease in delay times • Reliable, secure network • Unfortunately there are many questions • Cost comparisons? • Is the maintenance of the MAs worth the benefits? • Practical to deploy with modern technology? • If not now, when?