Chapter 6 Phases Equilibria
Chapter 6 Phases Equilibria. 6.1 Equilibrium Between Phases. Number of Components. The number of phases ( p ) is the number of phases which are homogeneous and distinct regions separated by definite boundaries from the rest of the system. ice cubes in water.

Chapter 6 Phases Equilibria
E N D
Presentation Transcript
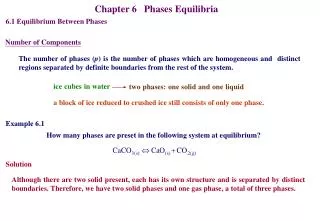
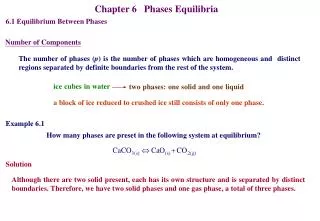
Chapter 6 Phases Equilibria 6.1 Equilibrium Between Phases Number of Components The number of phases (p) is the number of phases which are homogeneous and distinct regions separated by definite boundaries from the rest of the system. ice cubes in water two phases: one solid and one liquid a block of ice reduced to crushed ice still consists of only one phase. Example 6.1 How many phases are preset in the following system at equilibrium? Solution Although there are two solid present, each has its own structure and is separated by distinct boundaries. Therefore, we have two solid phases and one gas phase, a total of three phases.
The number of components (c) is the smallest number of independent chemical constituents needed to fix the composition of every phase in the system. H2O,NaCl,Na+,Cl- Water one component Water+NaCl two component The material balance and electroneutrality conditions reduce the number of constituents to two; that is, c=4-1-1=2. Note that the number of components is unique. If a chemical reaction can take place between constituents of a solution, the number of components is reduced by the number of equilibrium conditions. Considering the system ~We recognize three distinct chemical species. This number of species is reduced by the independent equilibrium condition and, therefore, c=3-1=2. ~Another reduction in the number of components is possible if we start with pure PCl5, in which case [PCl3]=[Cl2]. In this case the number of components is unity because of the additional mathematical relation.
Example 6.2 How many components are present when ethanol and acetic acid are mixed assuming the reaction to occur to equilibrium? Solution At first sight we might predict two components because there are two constituents, HOAc and EtOH. However, these constituents react and ethylacetate and water are also present at equilibrium. This raises the number of components from 2 to 4. But now the equilibrium condition is applied and reduces by 1 the number of components. Furthermore, since EtOAc and HOH must be formed in equal amounts, another mathematical condition exists, reducing the number of components back to 2; thus c=4-2=2. H2, O2, H2O three component room temperature H2+O2H2O two component higher temperature
Problem 6.5 How many components are present in the system CaCO3-CaO-CO2? Solution Starting with pure CaCO3, we have only one component present. When two of the three species are present, the third species is also present; but because of the equilibrium CaCO3CaO+CO2, there are only two components. Problem 6.6 How many components are present in the following system? Solution There are four individual gases, and the equilibrium equation reduces the number of independent components to three.
Degrees of Freedom The number of degrees of freedom (f) is the number of intensive variables, such as temperature, pressure, and concentration, that can be independently varied without changing the number of phases. Stated differently, the number of degrees of freedom is the number of variables that must be fixed in order for the condition of a system at equilibrium to be completely specified. If the system has one degree of freedom, we say it is univariant. If a system has two degrees of freedom, it is a bivariantsystem. Thus pure water is univariant since at any given temperature, the pressure of vapor in equilibrium with liquid is fixed (only the one variable, temperature, may be varied independently). Phase Rule where the term 2 is for two variables, temperature and pressure. Considering c components and p phases p-1 independent equations concentration terms temperature, pressure
Problem 6.3 Determine the number of degrees of freedom for the following system: a. A solution of potassium chloride in water at the equilibrium pressure. b. A solution of potassium chloride and sodium chloride at 1 atm pressure. c. Ice in a solution of water and alcohol. Solution a. For KCl and H2O at the equilibrium pressure, f=c-p+2=2-1+2=3 Since the equilibrium pressure is specified, this reduces the number of degrees of freedom to 2. b. Here, NaCl, KCl, and H2O are present. This is actually a three-component system since the solution contains Na+, K+, Cl-, and H2O. The first three compositions are reduce to two independent ones by the electroneutrality condition. Therefore, f=c-p+2=3-1+2=4, but with the restriction of constant pressure, the variance is reduced by 1, and is therefore 3. c. Ice, water, and alcohol are only two components. Consequently, f=c-p+2=2-2+2=2.
6.2 One-Component Systems The stable form of sulfur at 1 atm pressure and room temperature is a crystalline form called (ortho)rhombic sulfur (斜方硫). As rhombic sulfur is heated slowly at 1 atm, it transform to different crystalline form called monoclinic sulfur (單斜硫) at 368.55 K. The name allotrope (同素異性體) refers to each of the crystalline forms when this type of transformation occurs in elements. Figure 6.1 ~Monoclinic sulfur melts to the liquid along line CE. ~However, if the rhombic form is rapidly heated at 1 atm pressure, the transformation temperature of 368.55 K is bypassed and the rhombic form melts directly to liquid sulfur at 387 K. ~When the rhombic sulfur is in equilibrium with liquid, we have an example of a metastable equilibrium since this equilibrium position lies in the region of the more thermodynamically stable monoclinic form of sulfur. This is not a true equilibrium, but it appears to be one because the process of change into the more favored form is slow. In this region both the rhombic and liquid forms of sulfur can decrease their Gibbs energy by converting to the favored monoclinic form. The variation of vapor pressure with temperature may be handled using the Clapeyron equation.
The intersection of lines BC and CE is brought about by the difference in density of the two crystalline forms. The density of rhombic sulfur is greater than that of the monoclinic form, which has a density greater than that of the liquid. Therefore the lines BC and EC have positive slopes. triple point Figure 6.1 The system is invariant. This means that the equilibrium of the three phases automatically fixes both the temperature and pressure of the system, and no variable may be changed without reducing the number of phases present. curves AB, BC, BE, CE, and EF The system is univariant. Thus under conditions of two phases present either temperature or pressure may be varied, but once one of them is fixed along the respective equilibrium line, the final state of the system is completed defined.
In the four regions where single phases exist (namely rhombic, monoclinic, liquid, or vapor) we have f=1-1+2=2 and the system is bivariant. To define the state of the system completely the two variable temperature and pressure must both be specified. Figure 6.1 Point D is a metastable triple point with two-phase equilibrium occurring along lines BD, CD, and DE. The phase rule predicts the number of degrees of freedom regardless of the fact that the system is metastable, since the metastable system, within the time scale of the measurements, behaves as if it were at equilibrium. Thus we find invariant and univariant metastable systems as we did earlier for the corresponding stable equilibria.
6.3 Binary System Involving Vapor Liquid-Vapor Equilibria of Two-Component Systems Figure 6.2 liquid curve ~In the region marked “Liquid”, only one phase exists. There are two components so that from the phase rule, f=2-1-2=3. ~Since figure 6.2 is drawn at a specific temperature, one degree of freedom is already determined. Only two more variables are needed to specify the state of the system completely. A choice of P and x2 then completes the description. ~In the region marked “Vapor”, specific values of P and y2 will define the system. vapor curve
The line, called a tie line, intersects that liquid curve at l and the vapor curve at v. The composition x2 and y2 corresponding to l and v give the mole fractions of component 2 in the liquid phase and vapor phase, respectively. Figure 6.2 tie line lever rule In the region marked Liquid+Vapor, there are two phases present and the phase rule requires specification of only one variable since T is fixed. This variable may be P, x2, or y2.
Example 6.3 Determine the mass percentage of carbon tetrachloride CCl4 (P1*=114.5 Torr) in the vapor phase at equilibrium in a 1:1 mole ideal solution with trichloromethane CHCl3 (P2*=199.1 Torr) at 25 C. Solution Let the mole fraction of CCl4 in the vapor state be y1 and that of CHCl3 be y2 above the solution having mole fraction x1=0.5 CCl4. Then The ratio is So the mass percentage of carbon tetrachloride in the vapor is
Figure 6.2 If the liquid of pure component 2 has a higher vapor pressure than that of pure component 1, the vapor will contain relatively more of component 2 than does the liquid that is in equilibrium with it.
Problem 6.15 Calculate the composition of the vapor in equilibrium at 323 K with a liquid solution of 0.600 mol fraction 2-methy-1-propanol (isobutyl alcohol) and 0.400 mol fraction 3-methyl-1-butanol (isoamyl alcohol). The vapor pressure of pure isobutyl alcohol is 7.46 kPa and that of pure isoamyl alcohol is 2.33 kPa both at 323 K. Solution
Liquid-Vapor Equilibrium in Systems ~ Not Obeying Raoult’s Law Figure 6.3 When there are large, positive deviations from Raoult’s law, there will be a maximum in the total vapor pressure curve. The liquid-vapor equilibrium will then be established, as shown in Figure 6.3 for the chloroethene-ethanol system. This curve shows a maximum at 38 mol % ethanol at a constant temperature of 313.1 K. Figure 6.4 In a similar manner, there may be a minimum in the total vapor pressure curve for negative deviations from Raoult’s law. The liquid-vapor equilibrium is established as shown in Figure 6.4 for the acetone-chloroform system. Here a minimum occurs at approximately 58 mol % chloroform at 308 K.
Temperature-Composition Diagrams: Boiling Point Curves The right and left faces of the figure are the respective vapor-pressure curves of the pure liquids. For a typical, completely miscible binary system, the temperature and composition are represented along the two horizontal axes, and pressure along the vertical axis. higher vapor pressure Although the binary system may behave ideally, the straight line from a P against x plot for the total pressure of liquids is not a straight line in the temperature-composition plot. (The vapor pressure does not increase proportionally with T.)
Distillation Figure 6.7 將p點加熱,達到l點時,此時蒸氣之組成為v,其化合物2所佔有比例較多,若將此蒸氣移除,則剩餘液體內化合物 1所佔有比例較多。當溫度上升至1時,則系統移動至p’點,蒸氣組成由v移動至D而液體組成由l移動至R,此時蒸 氣與液體含量為level rule決定。 將p點加熱至p’點,蒸氣組成為D(yD)而液體組成為R(xR),將蒸氣冷凝至l’點,得到組成為xl’的液體,再將其汽化至v’,可得到組成為yv’的蒸氣,通常由於溫度會升高,所以會往D’點移動,然後再將其冷凝至l’’點,得到組成為xl’’的液體,再將其汽化至v’’,可得到組成為yv’’的蒸氣,如此可得到接近純化合物2的蒸氣,依此方式最後可以將混合物分離成純化合物1與化合物2,上述的過程稱為蒸餾 (distillation)。 Vapor pressure of component 2 is higher than that of component 1.
Problem 6.8 Answer the following equations, using the accompanying figure. a.A liquid mixture consists of 33 g of component A and 99 g of component B. At what temperature would the mixture begin to boil? b.Under the conditions in (a), what is the composition of the vapor when boiling first occurs? c.If the distillation is continued until the boiling point is raised by 5.0 C, what would be the composition of the liquid left in the still? 60 C 53% 88% Solution a. wt % of B=99/(33+99)*100=75%, from the graph at 75% B, the first vapor appears at 60 C. b. The composition of the vapor is given by the intersection of the tie line at the vapor curve. In this case, the vapor has a composition of 88% B. c. The intersection of the liquid line at 65 C corresponds to 53% B in the liquid.
Figure 6.8 In this device preheated liquid mixture enters the column about halfway up. The less volatile components drop to the bottom boiler or still, A, where they are reheated. As the vapor ascends the column, the higher-boiling components begin to condense while the lower-boiling material proceed to higher stages. Thus a temperature gradient is established, with the highest temperature at the bottom of the column and the lowest at the top from which the lowest-boiling solution may be removed. bubble-cap fractionating column
Figure 6.8 At each level in the column, such as B, vapor from the level or plate below bubbles through a thin film of liquid C, at a temperature slightly lower than that of the vapor coming through the bubble cap, D. Partial condensation of the vapor occurs. The lower-boiling mixture remains as vapor and moves to the next plate. Thus the vapor leaving each plate is enriched in the more volatile component compared to the entering vapor from the plate below. The action of the vapor condensing and then reevaporating is the same as described for the behavior shown in Figure 6.7. Excess liquid at each plate is returned to the plates below via overflow tubes, E. The reflux control allows part of the condensate to return to the column, where it continues to undergo further separation.
Azeotrope(共沸物) Mixtures corresponding to either a minimum or maximum in the boiling point curves are called azeotrope. Separation of azeotropic mixtures into two components by direct distillation is impossible. However, on pure component may be separated as well as the azeotropic composition. Figure 6.9 Figure 6.10
Figure 6.10 Considering Figure 6.10, if we heat a mixture having the azeotrope composition p, the mixture will boil unchanged; no separation is accomplished. If we now boil a mixture having composition p’, the first vapor to appear will have v’ and is richer in cis-1,2-dichloroethene, component 2. Continued fractionation, as described before, will eventually produce pure component 2 in the distillate with azeotrope as the residual liquid in the pot. Boiling a mixture at point p’’ results in vapor having composition v’’, which is much richer in tetrehydrofuran, component 1, than before. Fractionation can eventually yield pure component 1 at the head of the column and leave the azeotropic mixture in the pot. Similar results are obtained with a minimum boiling azeotrope except that the azeotrope composition is obtained at the head of the column and pure component remains behind in the still. Example of minimum boiling azeotrope are far more numerous than those exhibiting a maximum in their curves.
Azeotrope have sometimes been mistaken for pure compounds because they boil at a constant temperature. However, for an azeotrope a variation in pressure changes not only the boiling temperature but also the composition of the mixture, and this easily distinguishes it from a pure compound. This is demonstrated for HCl in Table 6.3. One of the more useful application of azeotrope in binary system is the preparation of a constant composition mixture. In the case of H2O and HCl, the constancy of the composition of this azeotrope allows its use as a standard solution of know composition.
Distillation of immiscible Liquids: Steam Distillation Considering the behavior of two liquids whose mutual solubility is so small that they may be considered immiscible, in this case each liquid exerts the same pressure as though it were the only liquid present. Thus the total pressure above the mixture at a particular temperature is simply the sum of the vapor pressures of the two components and remains so until one of the components disappears. If nAand nB are the amounts of each component present in the vapor, the composition of the vapor is If PT is the total pressure, and PA* and PB* are the vapor pressure of pure liquids A and B, respectively, then Since the ratio of partial pressure is a constant at a particular temperature, the ratio nA/nB must also be a constant. Thus the distillate is of constant composition as long as both liquids are present, and it boils at a constant temperature. Water is often one component when this type of distillation is used for purifying organic compounds. This process, called steam distillation, is frequently used for substances that would decompose when boiled at atmospheric pressure. What makes this process attractive is the high yield of organic materials brought about by the low molar mass of water and its convenient boiling point, in contrast to the relatively high molar masses of most organic substances.
Example 6.4 Toluene (methylbenzene) and water are immiscible. If boiled together under atmospheric pressure of 755 Torr at 83 C, what is the ratio of toluene to water in the distillate? The vapor pressure of pure toluene and water at 83 C are 322 Torr and 400.6 Torr, respectively. Solution Problem 6.13 Under atmospheric pressure 1 kg of pure naphthalene is to be prepared by steam distillation at 372.4 K. What mass of steam is required to perform this purification? The vapor pressure of pure water at 372.4 K is 98.805 kPa. Solution
Distillation of Partially Miscible Liquids Figure 6.11 Generally partial miscibility at low temperature is caused by large positive deviation from Raoult’s law, in which case we expect to find minimum in the boiling point-composition curve. As the pressure on the system is reduced, the boiling point curve generally intersects the liquid-liquid equilibrium curve, resulting in the curve for a typical system shown in Figure 6.11. Any composition in the range from 0 to xa and from xc to 1 will show the same behavior upon boiling as already demonstrated for minimum boiling azeotrope, with one exception. Two layers are formed if liquid at point p is evaporated and its vapor v condensed.
f=c-p+2=2-3+2=1-1=0 If solution of overall composition p’ is boiled at Te, three phases will be in equilibrium: liquid phase L1 having composition xa, liquid phase L2 having composition xc, and vapor having composition yb. Thus, as vapor of composition yb is removed, the composition of the two liquid phases does not change, only the relative amount of the two layers. In this particular case, continued distillation will cause all the L2 layer to be consumed. When it is exhausted, liquid L1 at a and vapor at b are left. The temperature may be increased at this same pressure; then the liquid composition changes along curve al and the vapor along bv. The last drop of liquid disappears when l and v are reached, and only vapor remains since this is the original composition of liquid from which the liquid p’ was produced. Figure 6.11 f=? f=? f=?
6.4 Condensed Binary Systems Two-Liquid Components Figure 6.12 ~The water-aniline system provides a simple example of partial miscibility (see Figure 6.12). ~If a small amount of aniline is added to pure water at any temperature below 441 K, the aniline dissolves in the water. ~If we work at a constant temperature of 363 K, pure water is present at point a and only one phase is present as aniline is added. However, as more aniline is added, point b on the solubility curve is reached and then, in addition to phase L1 of composition b, a slight amount of a second liquid phase L2 appears having composition e.
~The composition of the L1 layer is a solution of aniline in water and that of the L2 is a solution of water in aniline. ~As more aniline is added, the second liquid layer L2 becomes more evident and continually increases with the addition of aniline until the composition is given by point e. Beyond point e, only one phase is present. The same type behavior is observed as water is added to pure aniline. Figure 6.12 ~The composition of any point in the two-phase region along the tie line between points b and e is composed of varying proportions of solution L1 and of solution L2. These solutions are called conjugate solutions (共軛溶液). ~The composition of these layers depends on the temperature. The amount of the individual layers present may be determined using the lever rule.
~Constant composition lines, vertical on the diagram in Figure 6.12, are known asisopleths. ~As the temperature is increased from point c along the isopleth cc’ or indeed from any point left of the vertical dashed line joining Tuc, the solubility of the aniline in water layer, L1, grows as does the solubility of the water in aniline layer, L2. ~As a result of the change in solubility, the predominant layer L1 increases at the expense of the L2 layer. Similar behavior is observed for the L2 layer when the temperature is increased from point d. Figure 6.12 ~A different behavior is observed with the critical composition, which is the composition corresponding to the highest temperature Tuc at which two layer may coexist. (This temperature is know as the upper consolute temperature or critical solution temperature.) ~If the curve is symmetrical, the relative size of the layers remains constant as the temperature is raised along the dotted line. Above Tuc, only one phase exists.
Example 6.3 Calculate the ratio of the mass of the water-rich layer to that of the aniline-rich layer, for a 20-wt% water-aniline mixture at 363 K. Solution Using the lever rule, we have
Figure 6.13 ~Figure 6.13 shows an example of lower consolute temperature in the water-triethylamine system. ~The lower consolute temperature is 291.65 K, and above this temperature two immiscible layers exist. In this case the large positive deviations from Raoult’s law responsible for the immiscibility may be just balanced at the lower temperature by large negative deviations from Raoult’s law, which are normally associated with compound formation. Figure 6.14 ~Figure 6.14 shows the final type of liquid-liquid equilibrium, called a miscibility gap, is exhibited by the water-nicotine system. ~In this case the two-phase region is enclosed and has both an upper and lower consolute temperature at atmospheric pressure. This may be called a closed miscibility loop. It has been shown for this system that an increase of pressure can cause total solubility.
~An interesting example of liquid-liquid solubility in two material normally solid, and its application to a practical problem, is afforded by the Pb-Zn system. ~Figure 6.15 gives the phase diagram for this system to 1178 K, above which boiling occurs. ~Ignoring the details in the right- and left-hand extremes of the diagram, we see that miscibility occurs above the upper consolute temperature at 1071.1 K. ~The rather limited solubility of zinc in lead may be used in the metallurgical separation of dissolved silver in lead. ~The zinc is added to the melted lead, which has an economically recoverable amount of silver dissolved in it. The melt is agitated to effect thorough mixing. The zinc is then allowed to rise to the surface of the lead and is skimmed off. Because of the much higher solubility of silver in Zn than Pb, most of the silver will now be in the zinc. The zinc may be boiled off from this liquid to give the desired silver. Figure 6.15
Solid-Liquid Equilibrium: Simple Eutectic Phase Diagrams When a single-liquid melt formed from two immiscible solids is cooled sufficiently, a solid is formed. The temperature at which the solid is first formed is the freezing point of the solution, and this is dependent on the composition. Such a case is provided by the gold-silicon system shown in Figure 6.16. ~A curve that represents the boundary between liquid only and the liquid plus solid phase is known as a liquidus curve. If we begin with pure gold, the liquidus curve will start as xAu=1 and drop toward the center of the figure. The curve from the silicon side behaves in a similar manner. The temperature of intersection of the two curves, Te, is called the eutectic temperature (共熔溫度). ~The eutectic composition xe has the lowest melting point in the phase diagram. At the eutectic point, three phase are in equilibrium: solid Au, Solid Si, and liquid. At fixed pressure the eutectic point is invariant. This means that the temperature is fixed until one of the phases disappears. Figure 6.16
The relationship between phases is easy to follow if we isobarically cool the liquid represented by point p in a single-liquid-phase region. Figure 6.16 As the temperature is lowered, the first solid appears at l at the same temperature as the liquid. Since this is an almost completely immiscible system, the solid is practically pure gold. As the temperature is dropped further, more crystals of pure gold form. The composition of the liquid follows the line le, and the overall composition between liquid and solid is given by the lever rule. In this region of liquid plus solid, either the temperature or the composition may be varied. f=c-p+2=2-3+2=1-1=0 f=c-p+2=2-2+2=2-1=1 When point s is reached, three phase are in equilibrium: solid Au, solid Si, and liquid of composition xe. Since the system is invariant, the liquid phase is entirely converted into the two solids before the temperature may drop lower. Finally, at point p’, only two solid, Au and Si, exist. The right-hand of the diagram may be treated in the same way.
Figure 6.16 The mole fraction of silicon in the region near pure silicon varies with temperature according to the following equation: where T0 = melting point of Si. Problem 6.20 In Figure 6.16, a solution having composition p is cooled to just above the eutectic temperature (point s is about 0.18 xSi, and xe is 0.31 xSi); calculate the composition of the solid that separates and that of the liquid that remains. Solution 42% solid 58% liquid
6.5 Thermal Analysis The careful determination of phase boundaries, particularly in complicated metallic systems, is quite difficult and requires considerable effort. One method that has proved useful for phase determination is the technique of thermal analysis. In this technique a series of mixtures of known composition is prepared. Each sample is heated above its melting point and, where possible, is made homogeneous. Then the rate of cooling of each sample is followed very closely. Figure 6.17 Figure 6.17 shows a series of cooling curves in a plot of T against time and shows how individual points are used to form a phase diagram similar to Figure 6.16.
For the two pure materials the rate of cooling of the liquid melt is fairly rapid. When the melting temperature is reached, there is generally a little supercooling that is evidenced by a slight jog in the curve. This is shown in curve 1. The curve returns to the melting point and remains there until all the liquid is converted to solid. The temperature then drops more rapidly for the solid than for liquid since the heat capacity of a solid is generally lower than that of a liquid. Thus it requires less heat removal to cool the sample a fixed number of degrees. Figure 6.17 Curve 2 represent a mixture of some B in A. The mixture cools rapidly until point l is reached. This point appears on the liquidus curve. Liquid and solid are in equilibrium as the mixture cools more slowly along line ls. This is because of the heat that is released on solidification. At point s, a horizontal region appears called the eutectic halt. The liquid still present in the system must completely solidify before the temperature can drop farther. Once all the liquid is converted to solid, the temperature will drop. As with the pure materials, the cooling of two solids is much more rapid than if liquid were present.
Figure 6.17 ~The descriptions of curves 3 and 5 are the same as for curve 2 except for the lengths of the line l’s’ and l”s” and for the time that the system stays at the eutectic halt. This period at the eutectic halt provides a means to establish the eutectic temperature. ~In general the eutectic halt will lengthen, and lines like l’s’ will shorten, as the composition approaches the eutectic composition. ~The reason for this is that for the eutectic composition the cooling is rapid until the eutectic temperature is reached. After all the liquid is converted to solid, the mixture can then cool further. ~The temperature for each composition at which a change occurs in the cooling curve is then used to establish a point on the phase diagram, as is shown in the right-hand portion of Figure 6.17.
Figure 6.18 B A E 6.6 More Complicated Binary Systems ~Figure 6.18 shows the phase diagram of the water- NaCl system. ~The most obvious isothermal discontinuity occurs at -21.1 C, which is the eutectic temperature at a concentration of 23.3 wt%. ~A second discontinuity is a peritectic reaction at 0.1 C and 61.7 wt%, where there is exactly a 2:1 mole ratio of water to Na+Cl- ion pairs. This combination is sometimes referred to as a crystal dihydrate and more generally is termed a phase compound. Such mixture have a precise integral mole ratio defining the stoichiometry. ~As a few crystal of NaCl are dissolved in liquid water at room temperature, a liquid phase is formed that contains both water and the ions Na+ and Cl-. More added salt will dissolve up to a limit called the “solubility limit,” shown along EB in Figure 6.18. ~Up to this limit the salt and water are completely miscible. At this limit the solution is said to be “saturated” with salt. As still more salt is added, the salt concentration in the liquid phase does not change, and any crystals added beyond the solubility limit remain seemingly unchanged in contact with the liquid.
Figure 6.18 B A E ~The sufficient salt are mechanically mixed with ice to form a 40 wt% mixture of NaCl in water maintained at -10 C. A liquid phase is quickly formed, dissolving salt crystals up to the solubility limit. This freezing point curve for water is represented by the curve AE. ~In this case, however, the crystals in equilibrium with the saturated liquid are not the same as the those formed above 0 C. These latter crystals have the formula NaCl.2H2O. They differ in composition and structure from dry sodium chloride. One use of eutectic systems such as just described is to prepare a constant-temperature bath at some temperature below that of melting ice. If NaCl is added to ice, the ice melts. Indeed, if this is done in an insulated container, ice continues to melt with the addition of NaCl until -21.1 C is reached. Then the temperature of the system will remain invariant until all the ice has been melted by heat from an outside source. Table 6.4 presents several eutectic compositions involving different salts and water.
Solid Solutions ~Only one type of situation is known in which the mixture of two different substance may result in an increase of melting point. This is the case in which the two substances are isomorphous. ~In terms of metallic alloys this behavior is a result of the complete mutual solubility of the binary components. This can occur when the sizes of the two atoms of the two components are about the same. Then atoms of one type may replace the atoms of the other type and form a substitutional alloy. ~An example of this behavior is found in the Mo- V system, the phase diagram for which is shown in Figure 6.19. Addition of Mo to V will raise the melting point. Figure 6.19 The Cu-Ni system also forms a solid solution. Copper melts at 1356 K, and addition of nickel raises the temperature until for xNi=1 the temperature reaches 1726 K. An alloy known as constantan, consisting of 60 wt% Cu and 40 wt% Ni, has special interest since it is useful as one component of a thermocouple for the determination of temperature.
Partial Miscibility ~Figure 6.20 shows an example of the limited solubility for both components. ~Tin dissolves lead to a maximum of approximately 2.5 mol% or 1.45 wt %. Tin is more soluble in lead, dissolving to a maximum of 29 mol% at 466 K. ~The two-phase solid region is composed of these two solid alloys in proportions dictated by the lever rule. The situation is analogous to that represented in Figure 6.11 concerning liquid-vapor equilibrium where partial miscibility occurs in the liquid phase. Figure 6.20 Figure 6.11 2.5 mol% 71 mol%
Partial Miscibility Figure 6.21 ~Figure 6.21 shows another type of system in which partial miscibility occurs involves a transition point. ~A transition temperature exists along abc at which spinel, corundum, and liquid of composition c coexist and the system is invariant. At any temperature above the transition temperature the spinel phase disappears. ~Cooling of the liquid and corundum phases in the a to b composition range results in the formation of the spinel phase and coexistence of two solid phase. ~Cooling in the b to c range initially results in the disappearance of corundum and formation of spinel along with the liquid. Further, cooling results in solid spinel only. However, as the temperature falls further, corundum makes an appearance again. spinel:尖晶石 corundum:金剛砂
Figure 6.21 The region near 1300 K and 0.4 mol fraction Al2O3 appears to be similar to what has been described as a eutectic point. However, where liquid would be expected in a normal eutectic system, this region is entirely solid. An invariant point such as e surrounded solely by crystalline phases is called a eutectoid(共熔合金). At the eutectoid, phase reactions occur on change of heat resulting in a change in proportion of the solid phases exactly analogous to that at a eutectic point.
Problem 6.38 Describe what happens within the system Mn2O3-Al2O3 in Figure 6.21 when a liquid of xAl2O3=0.2 is cooled from 2100 K to 1200 K. Solution As liquid is cooled, solid spinel first appears at about 1950 K in equilibrium with liquid. At approximately 1875 K, all of the liquid converts to solid spinel, the composition of which varies according to the lever rule. As the temperature falls to about 1400 K, a two-phase region appears that is Mn3O4+spinel. Below about 1285 K, the spinel converts to corundum and Mn3O4+corudum coexist.
Compound Formation Sometimes there are such strong interactions between components that an actual compound is formed. Two types of behavior can then be found. In the first type, the compound formed melts into liquid having the same composition as the compound. This process is called congruent melting (合熔). In the second type, when the compound melts, the liquid does not contain melt of the same composition as the compound. This process is called incongruent melting (分熔). Figure 6.22 In figure 6.22 for the system Tl2O-TlBO2 the compound Tl3BO3 is formed and melts congruently at 725 K. A eutectic occurs at 8.2 wt% B2O3. Note that the X axis is plotted as weight percent B2O3 over a very limited range. The easiest way to interpret this figure is to mentally cut it in half along the line representing pure Tl3BO3. Then each half is treated as in Figure 6.16. The left-hand portion introduces a new feature that is often found out only in ceramic system such as this but also in metallic systems. At 627 K a reversible transformation occurs in the crystalline structure of Tl2O. A form called is stable below 627 K and the second form is stable above the transition temperature all the way to the melting point. It appears that there are now two points in this system that were previously described as eutectic points. However, only the lowest one is referred to as the eutectic point; other are called monotectic points.
In contrast to congruent melting, incongruent melting occurs for each of the compounds in the Au-K system shown in Figure 6.23. The composition of each compound formed is given by the formula alongside the line representing that compound. If we examine the compound K2Au as it is heated, we find that liquid of composition P is formed at 543 K: Figure 6.23 ~Since the liquid is richer in potassium than is solid KAu, some solid KAu will remain as solid. Thus the reaction is known as phase reaction or, more commonly, a peritectic reaction (過渡反 應). The point P is know as the peritectic point (分熔點). ~This reaction is reversible if liquid of the same total composition as K2Au is cooled. Solid KAu begins to separate at l. More solid KAu forms until the temperature of 543 K is reached. As heat is removed, the reverse of the peritectic reaction just shown occurs. ~From the lever rule, approximately 25 % of the material initially exists as particle of solid KAu surrounded by liquid of composition P. Thus the KAu is consumed as the reaction proceeds. As the last trace of liquid and KAu disappears, the temperature is free to drop and only K2Au is present. If the starting melt has a composition that is slightly rich in Au compared to K2Au (i.e., lies to the left of K2Au), cooling into the two-solid region will produce crystals of KAu surrounded by the compound K2Au.
Problem 6.23 The following information is obtained from cooling curve data on the partial system Fe2O3-Y2O3: Sketch the simplest melting point diagram consistent with these data. Label the phase regions and give the composition of any compounds formed. Solution
Problem 6.26 The following data for the magnesium-copper system is the result of analyzing cooling curve. Pure copper melts at 1085 C while pure magnesium melts at 659 C. Two compounds are formed, one at 16.05 wt% Mg with a melting point of 800 C, and the other at 43.44 wt% Mg with a melting point of 583 C, respectively. Construct the phase diagram from this information and identify the compositions of the eutectics. Solution