Download
1 / 31
310 likes | 459 Vues
Projections of the Australian population by Indigenous status: a progress report Prepared for: Summer School on Projection Methods for Ethnicity and Immigration Status Leeds University, July 2009 Tom Wilson. Who is Indigenous? (1) A definition from an international perspective:

E N D
Projections of the Australian population by Indigenous status: a progress report Prepared for: Summer School on Projection Methods for Ethnicity and Immigration Status Leeds University, July 2009 Tom Wilson
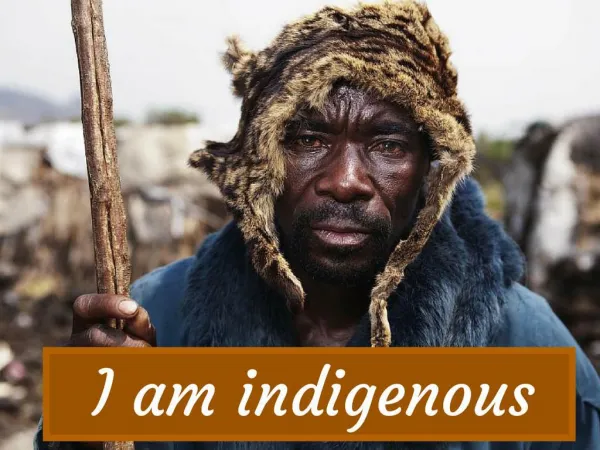
Who is Indigenous? (1) A definition from an international perspective: “Indigenous peoples include descendants of the original inhabitants of a country: * who have become encapsulated in their lands by a numerically and politically dominant invasive society, * who retain a cultural difference from that society, and * who self-identify as Indigenous” (Taylor 2003) Projections of the Australian population by Indigenous status
Who is Indigenous? (2) In Australia Indigenous refers to both Aboriginal and Torres Strait Islander peoples. What has become known as ‘The Commonwealth Definition’ was given in a High Court judgement in 1983: “An Aboriginal or Torres Strait Islander is a person * of Aboriginal or Torres Strait Islander descent * who identifies as an Aboriginal or Torres Strait Islander, and * who is accepted as such by the community in which he or she lives” Projections of the Australian population by Indigenous status
Who is Indigenous? (3) Operational definition employed by ABS in the Census and its surveys uses only one aspect of the Commonwealth definition: Is the person of Aboriginal or Torres Strait Islander origin? For persons of both Aboriginal and Torres Strait Islander origin mark both 'Yes' boxes. No Yes, Aboriginal Yes, Torres Strait Islander Projections of the Australian population by Indigenous status
Why produce population projections by Indigenous status? ► Need to plan service requirements (education, housing, employment, health, etc.). Large sections of the Indigenous population suffer considerable socio-economic disadvantage. ► Set targets for addressing discrimination (e.g. in labour market) Challenges in producing Indigenous status projections ► No data on some components of change ► Medium-poor quality of the data that is available ► No clear boundary between the Indigenous and non-Indigenous populations ► Indigenous issues are sensitive and very politicised ► Obtaining Indigenous demographic data from ABS can be difficult Projections of the Australian population by Indigenous status
What is the current Indigenous population of Australia? ABS have published experimental Indigenous Estimated Resident Population (ERP) for 30 June 2006. Based on 2006 Census but adjusted for * net underenumeration (a big adjustment) * timing difference between Census night (8 August) and 30 June For 30 June 2006: * Indigenous ERP was 517,000 * ERP for whole of Australia was 20,698,000 Indigenous population therefore 2.5% of national total Indigenous ERPs only updated after each Census (therefore no 2007 or 2008 ERPs) Projections of the Australian population by Indigenous status
Spatial distribution: States and territories NSW & Qld have largest Indigenous populations NT has by far largest % Source: ABS Projections of the Australian population by Indigenous status
Age-sex structure by Indigenous status Indigenous ERP, 2006 Non-Indigenous ERP, 2006 Source: ABS Projections of the Australian population by Indigenous status
How has the Indigenous population grown in recent years? Demographic balancing (or accounting) equation: national Australian population by Indigenous status Population (t+n) = Population at time t + births (t,t+n) - deaths (t,t+n) + immigration (t,t+n) - emigration (t,t+n) + ethnic mobility into the population - ethnic mobility out of the population Projections of the Australian population by Indigenous status
Estimated Resident Population of Australia's Indigenous population Coloured diamonds in graph are experimental ERPs Dashed lines are backcast ERPs allowing for births and deaths only Why the error of closure? * Overseas migration? * Identification change? * Undercount of nat. increase? * Census problems? Source: ABS Projections of the Australian population by Indigenous status
Earlier estimates of Australia's Indigenous population Indigenous ERPs not produced prior to 1986; Census counts only 1971 Census was first census in which a full Indigenous enumeration was attempted Prior to 1967 the constitution stated that: “In reckoning the numbers of the people of the Commonwealth, or of a State or other part of the Commonwealth, aboriginal natives should not be counted” Following a referendum in 1967 this section of the Constitution was removed Earlier censuses only counted Indigenous people in order to exclude them from official population counts Projections of the Australian population by Indigenous status
Earlier estimates of Australia's Indigenous population Pre-1986 Census counts of the Indigenous population 1971: 115,953 1976: 160,915 1981: 159,897 Not comparable with ERPs What was the Indigenous population at European contact (1788)? Various figures have been suggested Mulvaney & White, 1987 750,000 Taylor, 2006 No less than 500,000 Whatever the number it was larger than the Census count of 1971 Indigenous population subsequently declined * lower fertility * decimated by newly-introduced diseases Projections of the Australian population by Indigenous status
Mortality Difficult to measure Indigenous mortality rates and life expectancy Most deaths are thought to be registered but many deaths to Indigenous people are not recorded as such Until this year ABS used growth balance method to estimate Indigenous mortality However, now death counts are adjusted for undercount and Indigenous mortality is calculated directly via life tables Life expectancy at birth by Indigenous status, 2005-07 (years) Indigenous Non-Indigenous Females 72.9 82.6 (difference: 9.7 years) Males 67.2 78.7 (difference: 11.5 years) Source: Experimental Life Tables for Aboriginal and Torres Strait Islander Australians, Australia, ABS, 2009 Projections of the Australian population by Indigenous status
Mortality in the Northern Territory Northern Territory has the best Indigenous demographic data of all the states & territories Life expectancy calculated in conventional way Big improvements in long-run . . . . . . but no narrowing of the gap with total life expectancy Source: Wilson, Condon & Barnes, 2007 Projections of the Australian population by Indigenous status
Overseas migration Very little overseas migration exchanges of the Indigenous population but this is likely to change in the future Lots of overseas migration amongst the non-Indigenous population Increasingly temporary migration, esp. overseas students and business visa holders Projections of the Australian population by Indigenous status
Identification change / ethnic mobility Debate as to whether this really exists Very little direct information Cross-check of Indigenous status in Post-Enumeration Survey and in census reveals some differences. There may be some identification “change” from what is recorded for young children in the census compared what they report themselves in later censuses. Identity formation rather than change. Projections of the Australian population by Indigenous status
Fertility of Indigenous women Recent Indigenous fertility based on birth registrations Earlier fertility estimated from census children ever born question Projections of the Australian population by Indigenous status
Mothers and babies by Indigenous status, Australia, 1996-2001 Calculations by Kinfu & Taylor, 2002 and 2005, based on the own-children method Indigenous women Non-Indigenous women 39,179 1,522 14,633 Indigenous babies Non-Indigenous babies 53,812 Babies born to non-Indigenous women with Indigenous partners are an important contribution to Indigenous population growth (27%) Projections of the Australian population by Indigenous status
The increasing proportion of Indigenous births to non-Indigenous women Model presented by Alan Gray (2002) Reflects increasing intermarriage/ partnering Views all states as following logistic curve path Australia as a whole currently at about 28% Projections of the Australian population by Indigenous status
Exogamy (out-marriage) According to 2006 Census * 52% of Indigenous males in partnerships * 55% of Indigenous females in partnerships had a non-Indigenous partner/spouse (Heard et al. 2009) Higher % in urban areas e.g. 83% for Indigenous females in Sydney 8% in Balance of NT Higher % the higher the individual's educational attainment Higher % the higher the individual's income Breakdown of cultural barriers? Important implications for fertility & Indigenous population growth Projections of the Australian population by Indigenous status
A model for projecting Australia's population by Indigenous status Cohort-component model with 5 year age groups and 5 year projection intervals Movement accounts-based model Operationalised in Microsoft Excel with a projection horizon of 30 years Two population groups: Indigenous; non-Indigenous Model allows for ethnic mobility between populations Childbearing model permits non-Indigenous mothers to give birth to Indigenous babies (and vice versa) Projections of the Australian population by Indigenous status
Childbearing sub-model Very basic at present Births to Indigenous and non-Indigenous women calculated first These births are split, using simple proportions, into Indigenous & non-Indigenous births Advantage over ABS method which assumes all births to Indigenous women are Indigenous (about 4% are not) Where does the data for these proportions come from? * Census tables of 0-4 year olds by Indigenous status of mother * ABS birth statistics of Indigenous births but all births to Indigenous mothers classified as Indigenous under-reporting problem Projections of the Australian population by Indigenous status
Projection assumptions summary Jump-off pops 30 June 2006 ERPs TFRs Indigenous: 2.30 for 2006-11 ... 2.10 by 2016-21 Non-Indigenous: 1.90 for 2006-11; 1.85 thereafter 4.6% of births to Ind. women non-Indigenous, increasing by 10% per 5 year projection interval. 0.8% of births to non-Ind. women Indigenous, increasing by 10% per 5 year projection interval e(0) Ind F: 72.9 > 74.8 Ind M: 67.2 > 69.8 Non-Ind F: 83.9 > 88.1 Non-Ind M: 79.3 > 84.8 NOM Indigenous: zero Non-Indigenous: 180,000 per annum Identification No identification change Projections of the Australian population by Indigenous status
Projection results: Indigenous population 2006: 517,000 2036: 898,000 Annual numerical growth increases from 10,300 p.a in 2006-11 to 14,700 p.a. by 2031-36 Annual average growth rate declines v. slowly from 1.9% to 1.7% Projections of the Australian population by Indigenous status
Projection results: Indigenous age-sex profiles % increase by age 2006-36 2006 2036 % 0-14 38 31 % 15-64 59 61 % 65+ 3 8 Projections of the Australian population by Indigenous status
Projection results: births % of Indigenous births borne by non-Indigenous mothers increases from 29% in 2006-11 to 37% in 2031-26 Moving up Alan Gray's logistic curve model Projections of the Australian population by Indigenous status
Summary Indigenous population of Australia is disadvantaged and has high service needs (health, education, employment, aged care, etc.) Projections are essential for planning to meet these needs Projections indicate a fast growing population, with an important contribution from non-Indigenous women (partnered with Indigenous men) Growth at all ages, esp. elderly Indigenous population increasingly one of mixed ancestry (though we don't explicitly model that) Data is often poor quality (though gradually improving): past trends unclear, current population uncertain, future very uncertain Projections of the Australian population by Indigenous status
Projections of the Australian population by Indigenous status Heterogeneity of Australia's Indigenous population “The Indigenous population” often used in literature Considerable heterogeneity by geographical area, remoteness area, ancestry, culture, etc. Map shows % of Indigenous people speaking an Indigenous language at home, 2001 Source: Taylor, 2006
Next steps (1) Add simple partnership model (probably a static model) partnered with: Ind. M Non-Ind. M other Indigenous F 1 2 3 Non-Ind. F 4 5 6 other 7 8 n/a (2) Estimate & project TFRs for states 1-6 above (3) Distribute babies born to those in states 1-6 into Indigenous & non-Indigenous based on past trends Projections of the Australian population by Indigenous status
Future work The size, age structure and components of change of the Indigenous population are currently uncertain They have been uncertain in the past The future is even more uncertain ► Probabilistic projections (with probabilistic jump-off populations); & probabilistic estimates of past populations Projections of the Australian population by Indigenous status
The end Any questions? Projections of the Australian population by Indigenous status