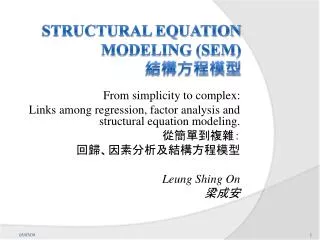
Structural Equation Modeling (SEM) 結構方程模型
From simplicity to complex: Links among regression, factor analysis and structural equation modeling. 從簡單到複雜: 回歸、因素分析及結構方程模型 Leung Shing On 梁成安. Structural Equation Modeling (SEM) 結構方程模型. Why do we need to know SEM? 為何需要認識結構方程模型?.

Structural Equation Modeling (SEM) 結構方程模型
E N D
Presentation Transcript
From simplicity to complex: Links among regression, factor analysis and structural equation modeling. 從簡單到複雜: 回歸、因素分析及結構方程模型 Leung Shing On 梁成安 Structural Equation Modeling (SEM)結構方程模型
Why do we need to know SEM?為何需要認識結構方程模型? • Even though your research or thesis only involves one (or two) methods, you need to know others because you need: 儘管你的研究論文只運用到一(或兩)個研究方法, 你需要認識其他的方法,因為: • to read other studies你會參考别人的研究; and • to broaden your own perspectives你需要擴闊知識
Why do we need to know SEM?為何需要認識結構方程模型? • If you use quantitative methods, you still need to know qualitative methods. 如果你使用量化的研究方法,你仍然需要認識質化的方法 • If you use regression, you still need to know factor analysis, etc. 如果你運用回歸,你仍然需要認識因素分析,等等。
An example on Educational Administration例一:教育行政 • How to make teachers work in a motivated environment? • 如何令教師在一個有動力的環境中工作?
An example on Sports & Physical Education例二:體育教學及運動 • How to stimulate students’ awareness to do more exercise? Or to participate in physical activities? • 如何令學生知覺到要多做運動?或實實在在的多做運動?
An example onCurriculum and Instruction例三: 課程與教學 • Are new teaching methods better than existing ones? • 某新教學方法比舊教學方法更好嗎?
An example onEducational Psychology 例四:教育心理學 • What are the relations of students’ background (age, sex, family income, etc.), parental relations, life adaptations with students’ self esteem? • 一個學生的自尊和他/她的背境(年齡、性別、家庭收入)、父母關係、生活適應有甚麼關係?
Before we answer these questions, we would like to ask why we measure?回答這些問題前,我們先要知道我們為何要測量?
Measurement is to measure variations測量是要量度差異 • The purpose of measurement is to distinguish high from low, heavy from light, good from bad, … etc, and hence is to measure variations. Therefore, variance (or variations, standard deviations, etc.) has to be maximized as much as possible. 測量的目的是要分辨出高低、輕重、好壞、等等, 即是要量度差異。因此,方差(或差異、標準差,等)儘可能被最大化。
Modeling 模型化 • The purpose of modeling is to explain variations (variance). Why somebody is taller, heavier, better … etc. Why some students have higher scores? 模型化的目的是要解釋差異。為什麼某些人會較别人高、重、或好,等等。。。為什麼某些學生的成績比較高? r2 = percentage of variance explained 被解釋差異的百分比
Simple Regression 簡單回歸 • 1 IV & 1 DV 一個自變項及一個因變項 • y = a + b x • x: IV, independent variable, 獨立(自)變項, 因 • y: DV, dependent variable, 依變項, 果 • y depends on x y 依靠 x
Examples 例子 • 3 IVs affect 1 DV separately三個自變項分别影响一個依變項 (3 separate simple regression) (三個普通回歸) Or 或 • 1 DV depends on 3 IVs separately 一個依變項依靠三個不同的自變項
Multiple Regression 多元回歸 y = a + b * x1 + c * x2 + d * x3 • 3 IVs affect 1 DV together 三個自變項同時影響一個依變項 • A main problem in multiple regression is multicollinearity! 主要的問題在於多元回歸是多元共線性的!
Limitations of Multiple Regression多元回歸的限制 • Multiple DVs are not permitted 不可多於一個依變項 • Mediating variables cannot be included (path analysis) 不可包含中介變量(路徑分析) • Each IV is assumed to be measured without error 假定毎一個自變項的測量是無誤的 • No Latent Variable (apart from error) 沒有潛在變項 • Multicollinearity hinder result interpretation 多元共線生阻礙結果分析
Multicollinearity 多元共線性 • Two or more predictor variables (x’s) in a multiple regression model are highly correlated. (Source: http://en.wikipedia.org/wiki/Multicollinearity) 多元回歸模型中兩個或以上的預測變項(x’s)是 高度相關的 • x1 Age年齡 will be excluded because x2 grade年級 is already there. x2 grade年級的存在以致x1 Age年齡被排斥在模型外
Examples 例子 • One DV (y): reading, reading ability of students 一個依變項(y): 學生閱讀能力 • x1: reading is interesting閱讀是有趣的 • x2: read quicker than others閱讀比别人快 • x3: reading better than others閱讀能力比别人好
Examples 例子 Their correlation matrix is: 相關矩陣圖:
Examples: Interpretation 例子:解釋 • The highest correlation between y and IVs are in x1. The second is x2 and the third is x3. So, we may expect the entering sequence: x1 -> x2 -> x3. 三個依變項當中,與y的相關係數最高是x1、其次是x2及x3。所以,在多元回歸模型中, 可預期自變項進入模型的次序應該是:x1 -> x2 -> x3. • But, in fact, the sequence is x1 -> x3 -> x2. 事實,結果是,自變項進入模型的次序是:x1->x3-> x2 • First, x1 enter because it has highest correlation with y among x1, x2 and x3. x1首先進入模型因為它與y的相關係數最高。
Examples: Interpretation例子:解釋 • But, (because of the effect of Multicollinearity), since x1 already present, the correlation of y with x2 and x3 has changed. In fact, which one enters next depends on the “partial” correlation between y with x2 and x3with x1 present. The formula for partial correlations is: 但是,(因為多元共線性的影響),x2及x3與y的相關係數因x1的存在而有所改變。實際上,x2及x3與y的部份相關(當x1存在下)決定了下一個進入模型的自變項。部份相關的方程式是:
Examples: Interpretation例子:解釋 • With this formula, the partial correlation between y with x2 and x3 with x1 present is: 按照這個方程式,x2及x3與y的部份相關(當x1存在下): • y vs x2 given x1; y 與 x2(x1存在下): 0.206 • y vs x3 given x1;y與 x3(x1存在下): 0.217 • That explain why x3 is entered before x2. 所以,x3 先進入模型,再到x2 • This explains Multicollinearity.這說明了多元共線性。 Note: This is because the relation between x1 and x2 is 0.271, which is larger than that between x1 and x3 (r =0.221), implying that the effects of x2 may be absorbed by x1 more than the corresponding effects of x3 (i.e. effects of x3 absorbed by x1).
Mediating Variable 中介變項 Here, “increased wisdom” is called mediating variable. 智慧增加 就是中介變項。
In the above discussion, all variables are observable. No latent variables 在以上的討論中,全部的變項都是「可見的」,沒有「潛在變項」
In simple regression, multiple regression, path analysis, etc. 於簡單回歸、多元回歸,及路徑分析,等等 • Identify IVs & DV辨認自變項及依變項 • All variables are observed variables (OV)所有變項都是可觀察變項 • No variables are latent variables (LV) 沒有潛在變項 X1 = λ1 F1 + e1 X2 = λ2 F2 + e2 … etc OV 可觀測變項 LV 潛在變項
Latent Vs Observed Variables潛在變項 Vs觀察變項 • The concept of Self EsteemVs items/questions in self esteem scales/questionnaires 自尊 vs 自尊量表的題目
10 items for Rosenberg self esteem scale Rosenberg自尊量表的10道題目 • 總括來說,我對自己感到滿意。 • 有些時候,我會覺得自己完全沒有用。 • 我覺得我有許多優點。 • 我能夠把事情做得和大多數人一樣好。 • 我覺得自己沒有什麼值得自豪的地方。 • 有時我真的感到自己沒有用。 • 我認為我是個有價值的人,至少與別人不相上下。 • 我要是能夠更尊重自己就好了。 • 總括來說,我傾向於感到自己像一個失敗者。 • 我抱著積極的態度面對自己。
Latent Variables 潛在變項 Vs Observed Variables 觀察變項 • In most tests and exams, marks in items are OV, total marks are LV. 在大部份的測驗中,項目得分為觀察變項,總分為潛在變項。 • In adding up all marks for all items, there are many assumptions involved. 在加總各個項目得分時,會存在有許多前提假設。
1 + 1 = ? 87 + 96 = ? 這兩條問題的「比重」一樣嗎? 可以相加嗎? Is the weight of these two items the same? Can they added up together?
孫中山是誰? 秦始皇是誰? 這兩條問題的「比重」一樣嗎? 可以相加嗎? Is the weight of these two items the same? Can they added up together?
Latent Variables 潛在變項 Vs Observed Variables 觀察變項 • Historically, the term factor analysis is used, but is largely the same as latent variable models. 傳統地一般會使用因素分析,實際內涵與潛在變項模型類似。 • Both factors and latent variables (LV) cannot be directly observed. 因素與潛在變項都無法被直接測量 • But, they can be indirectly measured. 但可以被間接測量
Why latent variables?為何要使用潛在變項? • Bartholomew & Knott, 1999 • Dimension reduction: We have observed so many variables (e.g. 50 questions in surveys or 60 items in tests). Can these information be summarized by using smaller number (e.g. 2 to 3) of latent variables, “without little loss of information”? 減少維度:用少數的潛在變項,來概括較多的外顯變項。如一份問卷調查中有50個項目或60條題目的測驗,我們希望能用一至兩個變項(通常是總分)來代替這些變項。但前題是:「留失最少的資料」
Why latent variables? 為何要使用潛在變項? • Bartholomew & Knott, 1999 Quantify latent construct: For example, can we measure self-esteem, academic ability, physical fitness, etc. (which cannot be directly observed) through a number of questions or items? 量化潛在結構:通過外顯的指標(如問卷題目)來測量潛在變項。例如,我們可以運用幾條項目或題目來評量一些不能被直接測量的變項(如自尊、學業能力及體能、等)嗎? Including sense of belonging and Math ability 包括對學校的歸屬感和數學能力
Why latent variables?為何要使用潛在變項? • Conditional independence: How can the “inter-dependence” of a set of questions or items be accounted by a fewer number of latent factors or variables. For example, can the inter-dependence of 10 MC items in Maths test explained by a single latent Maths ability scores. (The Maths ability scores are latent because we only observe answers in 10 MC items, and the scores are formed by summing up all items, say.) 條件獨立:相互關聯-用少量的潛在因素或變項,概括一套相關聯的指標或項目。例如, 通過加總10道相關聯的mc題目的分數,總分用一個獨立的潛在變項「數學能力」來解釋。
Note: Factor analysis should be more appropriately called internal structure analysis. There is NO cause (IV) & effect (DV) involved, but OV & LV (factors). The term “factor” stands for internal component rather than something external. 注意:因子分析更恰當地應該被稱為「潛在結構分析」。當中不涉及「自變項」與「依變項」的因果關係,而是可觀測變項與潛在變項的交互關係。「因素」代表的是內在要素,而不是其他變項帶來影響的變項。
Basic Concepts of Factor Analysis 因素分析的基本概念 探索性因素分析Exploratory Factor Model (Nokelainen, 1999.)
Basic Concepts of Factor Analysis 因素分析的基本概念 驗證性因素分析Confirmatory Factor Model (Nokelainen, 1999.)
Structural Equation Modeling結構方程模型 • SEM is a combination of FA, Path Analysis and Multiple Regression. SEM是結合因子分析、路徑分析與多元回歸的統計方法 • The objective of SEM is to investigate a set of relationships between (and among) IVs & DVs; OVs & LVs. SEM的目的是探討依變項與自變項,可觀測變項與潛在變項之間的關係。 • SEM is a statistical method used to test (or confirm) theoretical structures. SEM是用來檢測(驗證)理論模型的統計方法
Structural Equation Modeling • The null hypothesis (“Ho”) under test is that the model fits the data, and so researchers often hope to find non-significant results so that null hypothesis can be supported (i.e. not rejected).SEM的原假設 (虛無假設)(“Ho”) 是模型恰好擬合數據。所以研究者希望差異沒有達到顯著性水平。 • Put it in other words, researchers are testing a theory which is pre-decided and previously planned, based on existing theories or otherwise. 換句話說,研究者是在驗證基於已有的理論建立模型,與數據的擬合程度。 • Very complicated and multi-dimensional models can also be tested in SEM. It allows complete and simultaneous tests of all relationships. 複雜和多維度的模型都能在SEM中加以驗證。SEM 可以同時檢驗因素結構和因素關係。
An example on Educational Administration • How to make teachers to work in a motivated environment? • 如何令教師在一個有動力的環境中工作? 教師背景 = OV = LV 教師知覺工作環境 教師知覺 領導方式
An example on Educational Administration 題目1 題目1 .… 題目2 題目2 教師背景 = OV = LV 教師知覺工作環境 題目n 題目n …. 教師知覺 領導方式
An example on Educational Administration • There are sub-scales involved in each scale which makes models more complicated. But, the fundamental principle remains the same. 毎一量表下都包含次量表。顯然模型更加複雜了。但核心的分析原則保持不變。 • The advantage of having more sub-scales and items: more chances for more varieties, more model modifications & improvement, etc. 包含更多次量表與項目的優點:模型結構更加多樣化,更利於模型修正。
An example on Sports & Physical Education • How to stimulate students’ awareness to do more exercise? Or to participate in physical activities? • 如何令學生知覺到要多做運動?或實實在在的多做運動? 運動障礙 = OV = LV 運動利益 運動改變 運動效能
An example on Sports & Physical Education 題目1 題目2 …. 題目n 題目1 題目1 題目1 題目2 題目2 題目2 運動障礙 = OV = LV 題目n 題目n 題目n …. …. …. 運動利益 運動改變 運動效能
An example onCurriculum and Instruction • Are new teaching methods better than existing ones? • 某新教學方法比舊教學方法更好嗎? 組别 = OV = LV 後測 前測
An example onCurriculum and Instruction 題目1 題目1 .… 題目2 題目2 組别 = OV = LV 後測 題目n 題目n …. 前測
An example onEducational Psychology • What are the relations of students’ background (age, sex, family income etc), parental relations, life adaptations with students’ self esteem? • 一個學生的自尊和他/她的背境(年齡、性別、家庭收入)、父母關係、生活適應有甚麼關係? 學生背景 = OV = LV 學生與父母關係 自尊 學生生活適應
An example onEducational Psychology 題目1 題目1 題目1 .… 題目2 題目2 題目2 學生背景 = OV = LV 題目n 題目n 題目n …. …. 學生與父母 關係 自尊 學生生活適應
How? 如何? • Use statistical software 利用統計軟件 • AMOS (Analysis Of Moment Structures) • Steps 步驟: • Read data 讀取數據 • Define models to be tested 解釋將要被檢測的模型 • Run analysis 進行分析 • Models modifications 修正模型
Concluding remarks 總結 • set up your research questions 建立研究問題 • set up models to be tests according to your questions 根據研究問題建立被測試的模型 • modify or go back if necessary 必要時作出修正 • Attitude 態度 • hard thinking (IQ) is needed 需要深思熟慮 • consistency (EQ) is needed 需要堅持
References • 邱皓政&溫福星. (2009). 線性結構模型分析--結構方程模式與階層線性模式. 取自於http://hawjeng.myweb.hinet.net/972SEM.pdf • Fitting a latent growth curve model. (n.d.). Retrieved on April 22, 2009, from the University of Texas at Austin, Division of Statistics and Scientific Computation Website: http://ssc.utexas.edu/consulting/answers/amos/amos4.html • Nokelainen, P. (2009). Structural Equation Modeling with AMOS. Retrieved on April 22, 2009, from University of Tampere, Research Center for Vocational Education Website: http://www.uta.fi/aktkk/lectures/sem_en/pdf/sem_exercise_v2.3.pdf • Nokelainen, P. (2009). Structural Equation Modeling in Educational Research. Retrieved on April 22, 2009, from University of Tampere, Research Center for Vocational Education Website: http://www.uta.fi/aktkk/lectures/sem_en/
![Data Modeling [Comparison of data modeling techniques ]](https://cdn0.slideserve.com/205866/data-modeling-comparison-of-data-modeling-techniques-dt.jpg)