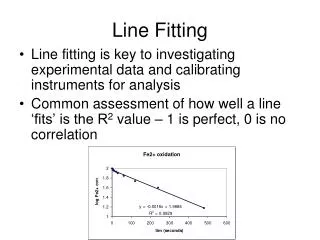
Fitting
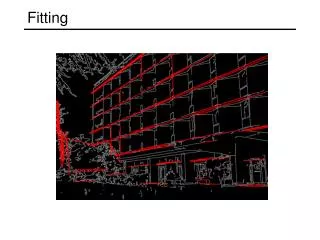
Fitting. Fitting: Motivation. We’ve learned how to detect edges, corners, blobs. Now what? We would like to form a higher-level, more compact representation of the features in the image by grouping multiple features according to a simple model. 9300 Harris Corners Pkwy, Charlotte, NC. Fitting.
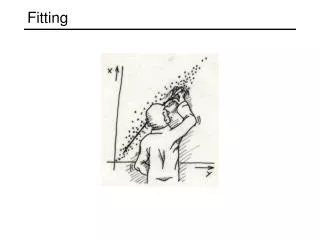

Fitting
E N D
Presentation Transcript
Fitting: Motivation • We’ve learned how to detect edges, corners, blobs. Now what? • We would like to form a higher-level, more compact representation of the features in the image by grouping multiple features according to a simple model 9300 Harris Corners Pkwy, Charlotte, NC
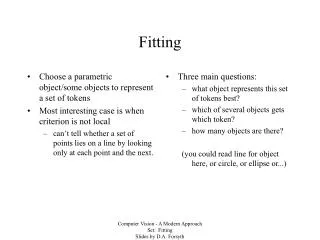
Fitting • Choose a parametric model to represent a set of features simple model: circles simple model: lines complicated model: car Source: K. Grauman
Fitting • Choose a parametric model to represent a set of features • Membership criterion is not local • Can’t tell whether a point belongs to a given model just by looking at that point • Three main questions: • What model represents this set of features best? • Which of several model instances gets which feature? • How many model instances are there? • Computational complexity is important • It is infeasible to examine every possible set of parameters and every possible combination of features
Fitting: Issues • Noise in the measured feature locations • Extraneous data: clutter (outliers), multiple lines • Missing data: occlusions Case study: Line detection
Fitting: Issues • If we know which points belong to the line, how do we find the “optimal” line parameters? • Least squares • What if there are outliers? • Robust fitting, RANSAC • What if there are many lines? • Voting methods: RANSAC, Hough transform • What if we’re not even sure it’s a line? • Model selection
Least squares line fitting • Data: (x1, y1), …, (xn, yn) • Line equation: yi = mxi + b • Find (m, b) to minimize y=mx+b (xi, yi)
Least squares line fitting • Data: (x1, y1), …, (xn, yn) • Line equation: yi = mxi + b • Find (m, b) to minimize y=mx+b (xi, yi) Normal equations: least squares solution to XB=Y
Problem with “vertical” least squares • Not rotation-invariant • Fails completely for vertical lines
Total least squares • Distance between point (xn, yn) and lineax+by=d (a2+b2=1): |ax + by – d| • Find (a, b, d) to minimize the sum of squared perpendicular distances ax+by=d Unit normal: N=(a, b) (xi, yi)
Total least squares • Distance between point (xn, yn) and lineax+by=d (a2+b2=1): |ax + by – d| • Find (a, b, d) to minimize the sum of squared perpendicular distances ax+by=d Unit normal: N=(a, b) (xi, yi) Solution to (UTU)N = 0, subject to ||N||2 = 1: eigenvector of UTUassociated with the smallest eigenvalue (least squares solution to homogeneous linear systemUN = 0)
Total least squares second moment matrix
Total least squares second moment matrix N = (a, b)
Least squares as likelihood maximization • Generative model: line points are corrupted by Gaussian noise in the direction perpendicular to the line ax+by=d (u, v) ε (x, y) point on the line normaldirection noise:zero-meanGaussian withstd. dev. σ
Log-likelihood: Least squares as likelihood maximization • Generative model: line points are corrupted by Gaussian noise in the direction perpendicular to the line ax+by=d (u, v) ε (x, y) Likelihood of points given line parameters (a, b, d):
Least squares for general curves • We would like to minimize the sum of squared geometric distances between the data points and the curve (xi, yi) d((xi, yi), C) curve C
Least squares for conics • Equation of a general conic:C(a, x) = a · x = ax2 + bxy + cy2 + dx + ey + f = 0, a = [a, b, c, d, e, f], x = [x2, xy, y2,x, y, 1] • Minimizing the geometric distance is non-linear even for a conic • Algebraic distance: C(a, x) • Algebraic distance minimization by linear least squares:
Least squares for conics • Least squares system: Da = 0 • Need constraint on a to prevent trivial solution • Discriminant: b2 – 4ac • Negative: ellipse • Zero: parabola • Positive: hyperbola • Minimizing squared algebraic distance subject to constraints leads to a generalized eigenvalue problem • Many variations possible • For more information: • A. Fitzgibbon, M. Pilu, and R. Fisher, Direct least-squares fitting of ellipses, IEEE Transactions on Pattern Analysis and Machine Intelligence, 21(5), 476--480, May 1999
Least squares: Robustness to noise • Least squares fit to the red points:
Least squares: Robustness to noise • Least squares fit with an outlier: Problem: squared error heavily penalizes outliers
Robust estimators • General approach: minimizeri (xi, θ) – residual of ith point w.r.t. model parametersθρ – robust function with scale parameter σ The robust function ρ behaves like squared distance for small values of the residual u but saturates for larger values of u
Choosing the scale: Just right The effect of the outlier is eliminated
Choosing the scale: Too small The error value is almost the same for everypoint and the fit is very poor
Choosing the scale: Too large Behaves much the same as least squares
Robust estimation: Notes • Robust fitting is a nonlinear optimization problem that must be solved iteratively • Least squares solution can be used for initialization • Adaptive choice of scale:“magic number” times median residual
RANSAC • Robust fitting can deal with a few outliers – what if we have very many? • Random sample consensus (RANSAC): Very general framework for model fitting in the presence of outliers • Outline • Choose a small subset uniformly at random • Fit a model to that subset • Find all remaining points that are “close” to the model and reject the rest as outliers • Do this many times and choose the best model M. A. Fischler, R. C. Bolles. Random Sample Consensus: A Paradigm for Model Fitting with Applications to Image Analysis and Automated Cartography. Comm. of the ACM, Vol 24, pp 381-395, 1981.
RANSAC for line fitting • Repeat N times: • Draw s points uniformly at random • Fit line to these s points • Find inliers to this line among the remaining points (i.e., points whose distance from the line is less than t) • If there are d or more inliers, accept the line and refit using all inliers
Choosing the parameters • Initial number of points s • Typically minimum number needed to fit the model • Distance threshold t • Choose t so probability for inlier is p (e.g. 0.95) • Zero-mean Gaussian noise with std. dev. σ: t2=3.84σ2 • Number of samples N • Choose N so that, with probability p, at least one random sample is free from outliers (e.g. p=0.99) (outlier ratio: e) Source: M. Pollefeys
Choosing the parameters • Initial number of points s • Typically minimum number needed to fit the model • Distance threshold t • Choose t so probability for inlier is p (e.g. 0.95) • Zero-mean Gaussian noise with std. dev. σ: t2=3.84σ2 • Number of samples N • Choose N so that, with probability p, at least one random sample is free from outliers (e.g. p=0.99) (outlier ratio: e) Source: M. Pollefeys
Choosing the parameters • Initial number of points s • Typically minimum number needed to fit the model • Distance threshold t • Choose t so probability for inlier is p (e.g. 0.95) • Zero-mean Gaussian noise with std. dev. σ: t2=3.84σ2 • Number of samples N • Choose N so that, with probability p, at least one random sample is free from outliers (e.g. p=0.99) (outlier ratio: e) Source: M. Pollefeys
Choosing the parameters • Initial number of points s • Typically minimum number needed to fit the model • Distance threshold t • Choose t so probability for inlier is p (e.g. 0.95) • Zero-mean Gaussian noise with std. dev. σ: t2=3.84σ2 • Number of samples N • Choose N so that, with probability p, at least one random sample is free from outliers (e.g. p=0.99) (outlier ratio: e) • Consensus set size d • Should match expected inlier ratio Source: M. Pollefeys
Adaptively determining the number of samples • Inlier ratio e is often unknown a priori, so pick worst case, e.g. 50%, and adapt if more inliers are found, e.g. 80% would yield e=0.2 • Adaptive procedure: • N=∞, sample_count =0 • While N >sample_count • Choose a sample and count the number of inliers • Set e = 1 – (number of inliers)/(total number of points) • Recompute N from e: • Increment the sample_count by 1 Source: M. Pollefeys
RANSAC pros and cons • Pros • Simple and general • Applicable to many different problems • Often works well in practice • Cons • Lots of parameters to tune • Can’t always get a good initialization of the model based on the minimum number of samples • Sometimes too many iterations are required • Can fail for extremely low inlier ratios • We can often do better than brute-force sampling