5 Kelvin Waves
5 Kelvin Waves. 5.1 Introduction 5.2 Theory 5.3 Observations of Convectively Coupled Kelvin Waves 5.3.1 Power Spectra 5.3.2 Kelvin Waves over Africa 5.3.3 Kelvin Waves and Atlantic Tropical Cyclones 5.3.4 Kelvin Waves and Other regions!. 5.1 Introduction.

5 Kelvin Waves
E N D
Presentation Transcript
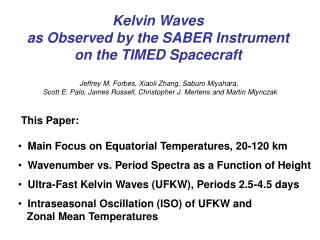
5 Kelvin Waves 5.1 Introduction 5.2 Theory 5.3 Observations of Convectively Coupled Kelvin Waves 5.3.1 Power Spectra 5.3.2 Kelvin Waves over Africa 5.3.3 Kelvin Waves and Atlantic Tropical Cyclones 5.3.4 Kelvin Waves and Other regions!
5.1 Introduction 1998 CLAUS Brightness Temperature 5ºS-5º N
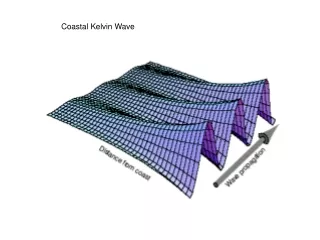
5.1 Introduction • Kelvin waves were first identified by William Thomson (Lord Kelvin) in the nineteenth century. • Kelvin waves are large-scale waves whose structure "traps" them so that they propagate along a physical boundary such as a mountain range in the atmosphere or a coastline in the ocean. • In the tropics, each hemisphere can act as the barrier for a Kelvin wave in the opposite atmosphere, resulting in "equatorially-trapped" Kelvin waves. • Oceanic Kelvin waves are thought to be important for initiation of El Niño Southern Oscillation (ENSO). • Atmospheric Kelvin waves are a key component of of the MJO.
5.1 Introduction • Convectively-coupled atmospheric Kelvin waves have a typical period of 6-7 days when measured at a fixed point and phase speeds of 12-25 m s-1. • Dry Kelvin waves in the lower stratosphere have phase speed of 30-60 m s-1. • Kelvin waves over the Indian Ocean generally propagate more slowly (12–15 m s-1) than other regions. • They are also slower, more frequent, and have higher amplitude when they occur in the active convective stage of the MJO.
5.2 Theory See Notes Wind, Pressure (contours), Divergence, blue negative
Theoretical Dispersion Relationships for Shallow Water Modes on Eq. Plane Frequency ω Matsuno, 1966 Zonal Wavenumber k
Theoretical Dispersion Relationships for Shallow Water Modes on Eq. Plane Frequency ω Westward Eastward Matsuno, 1966 Zonal Wavenumber k
Theoretical Dispersion Relationships for Shallow Water Modes on Eq. Plane Eastward Inertio-Gravity Westward Inertio-Gravity n = 4 Kelvin n = 3 n = 2 Frequency ω n = 1 n = 0 n = -1 Mixed Rossby-gravity (Yanai) Matsuno, 1966 Equatorial Rossby n = 1 n = 3 Zonal Wavenumber k
Kelvin Wave Theoretical Structure Wind, Pressure (contours), Divergence, blue negative
Model experiment: Gill model Multilevel primitive atmospheric model forced by latent heating in organized convection over 2 days. imposed heating Vectors: 200 hPa horizontal wind anomalies Contours: surface temperature perturbations
5.3 Observations 5.3.1 Power Spectra Important References See: Wheeler and Kiladis (1999) Convectively Coupled Equatorial Waves: Analysis of Clouds and Temperature in the wavenumber-frequency domain, JAS, 56, 374-399 As of today cited 570 times! See also: Kiladis et al (2009): Convectively Coupled Equatorial Waves, Rev. Geophys., 47, doi:10.1029/2008RG000266.
Wave-number frequency spectrum of convectively coupled equatorial waves CLAUS Tb Averaged 15ºS-15ºN, 1983–2005 Symmetric component Courtesy of G. Kiladis
Wave-number frequency spectrum of convectively coupled equatorial waves 1.25 Days Westward Power Eastward Power 96 Days
Wave-number frequency spectrum of convectively coupled equatorial waves Kelvin
Wave-number frequency spectrum of convectively coupled equatorial waves Outgoing Longwave Radiation (OLR) Average: 15ºS-15ºN, 1979–2001 Symmetric component Background removed Wheeler and Kiladis, 1999
Raw power spectra of OLR in 15S-15N band for years 1979-2000. Separately for anti-symmetric and symmetric parts about the equator. Normalized power spectra Convectively-coupled equatorial waves (CCEWs) Courtesy of NCAR, adapted from Wheeler and Kiladis (1999) MJO
5.3.2 Kelvin Waves over Africa Some motivation for studying Kelvin Waves over Africa 2-6d filtered TB (shaded) and 700hPa (contoured); averaged in 10-15N From Mekonnen et al, 2006 (J. Climate).
5.3.2 Kelvin Waves over Africa Average Kelvin filtered TB variance (JAS 1984-2004) • Peaks over tropical Africa, equatorial Indian Ocean, tropical Pacific • Max. over Africa near 10N, 20E
5.3.2 Kelvin Waves over Africa Base point : 10N, 20E Composites based on regression technique …. Total fields (TB, wind, height, velocity potential, etc. ) are lag regressed onto Kelvin filtered time series at a base point. The results are anomalies with respect to -1 standard deviation of the base point Kelvin filtered time series.
KTBanomalies (shaded), Velocity potential @ 200-hPa (contoured) Winds can be separated into their contribution to the divergent and rotational flow. The velocity potential highlights the regions where the winds are divergent and convergent. Negative values are associated with large-scale regions or divergence. Lag (days)
KTBanomalies (shaded), Velocity potential @ 200-hPa (contoured) Lag (days)
Day -4 Evolution from lag day -4 to day 4: Convection, 850mb , Geopotential height anomalies ( significant > 95%) Day -2 Day 0
Day 2 Day 4 Evidence, based on composite analysis, of eastward moving convective envelope associated with dynamical signals that can be tracked back to the Pacific and western Atlantic.
Source regions? Kelvin convection that originate in a 10o-wide in the region between 180W-90E ( in Lat 7-12N). The Kelvin waves are -5K and waves must propagate at least for 4-days and for 5000km from the origin
Summary of composite analysis: • Evidence of convectively coupled Kelvin wave that originated over central and eastern Pacific and western Atlantic that have significant impact over tropical Africa • Convectively coupled Kelvin wave characterized by an average Cph ~15m/s and ~5000-6000km
Weather event:July-September 1987 (high Kelvin variance year)
convection (TB < 260K) and Kelvin filtered TB < -5K (only negatives shown). Lat. Average: 7-12N. Decayed Aug. 18 Started July 29
Aug. 1987 Aug. Aug. Aug.
Kelvin wave (shaded), enhanced AEWs (contoured, only one phase shown). A series of AEWs that were initiated or enhanced in association with Kelvin wave (AEWs are labeled). AEW-4 became TS Bret, the first tropical storm of the season.
Weather event (July-September 1987): • A Kelvin wave that started over east Pacific reached Africa 6-7days later had a strong impact on convection • Convective activity over tropical Africa deepens and rainfall sharply increases with the approach of the Kelvin wave • Convection weakens after the Kelvin wave passed by the region • A series of AEWs were initiated over Africa in association with enhanced Kelvin wave
The Berry and Thorncroft (2005) AEW formed during the passage of the convectively active phase of a CCKW A time-longitude plot of TRMM 3B42 unfiltered rain rate anomalies (shaded) during 2000 July 20-August 10. Kelvin filtered TRMM anomalies are overlaid. The +/- 2 mm/day Kelvin filtered TRMM anomaly is only contoured. Negative Kelvin filtered TRMM anomalies are dashed.
Time-longitude composite of 2-10d filtered EKE averaged over each day of the CCKW index from 7.5-15°N. Kelvin filtered OLR anomalies are contoured (dashed if negative).
AA EA IO PO Kelvin-wave-filtered OLR variance 90 50 Wheeler and Kiladis 1999 The Kelvin wave domain is represented by the green polygon 25 12 8 (5oS-5oN) meridional mean Kelvin wave filtered OLR variance • Peaks from the Amazon-Atlantic (AA) in March to the Pacific ocean (PO) in June. • Strongest signal over Equatorial Africa (EA) in April • Equatorial position of the ITCZ in spring.
Kelvin-domain-filtered symetric OLR variance in Spring (MAM)
Kelvin-domain-filtered symetric OLR variance in Spring (MAM)
L H Evolution of Kelvin waveNegative phase • OLR (W/m2) • Shading: min convection • max convection • Wind at 850 hPa (m/s) • Vectors, significant at the T-test 99% level • Surface Pressure (Pa) • Contours dashed: low L • continue: high H
H L Evolution of Kelvin waveInitiation phase • OLR (W/m2) • Shading: min convection • max convection • Wind at 850 hPa (m/s) • Vectors, significant at the T-test 99% level • Surface Pressure (Pa) • Contours dashed: low L • continue: high H
L H Evolution of Kelvin waveActive phase • OLR (W/m2) • Shading: min convection • max convection • Wind at 850 hPa (m/s) • Vectors, significant at the T-test 99% level • Surface Pressure (Pa) • Contours dashed: low L • continue: high H
H Evolution of Kelvin wave Dissipation phase • OLR (W/m2) • Shading: min convection • max convection • Wind at 850 hPa (m/s) • Vectors, significant at the T-test 99% level • Surface Pressure (Pa) • Contours dashed: low L • continue: high H