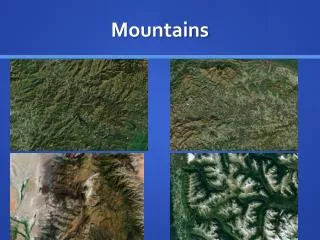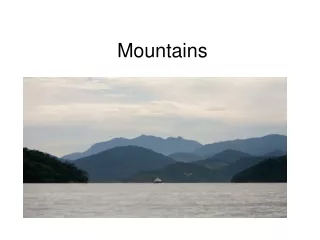
Uinta Mountains
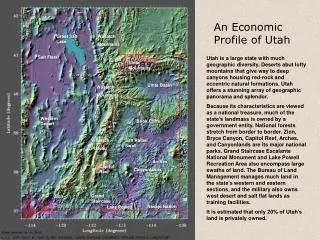
An Economic Profile of Utah. Great Salt Lake. Wasatch Mountains. Salt Flats.

Uinta Mountains
E N D
Presentation Transcript
An Economic Profile of Utah Great Salt Lake Wasatch Mountains Salt Flats Utah is a large state with much geographic diversity. Deserts abut lofty mountains that give way to deep canyons housing red-rock and eccentric natural formations. Utah offers a stunning array of geographic panorama and splendor. Because its characteristics are viewed as a national treasure, much of the state’s landmass is owned by a government entity. National forests stretch from border to border. Zion, Bryce Canyon, Capitol Reef, Arches, and Canyonlands are its major national parks. Grand Staircase Escalante National Monument and Lake Powell Recreation Area also encompass large swaths of land. The Bureau of Land Management manages much land in the state’s western and eastern sections, and the military also owns west desert and salt flat lands as training facilities. It is estimated that only 20% of Utah’s land is privately owned. Uinta Mountains Uinta Basin Wasatch Mountains Western Desert Book Cliffs Wasatch Plateau San Rafael Swell Arches Capitol Reef Canyonlands Bryce Grand Staircase Zion Navajo Nation Lake Powell
Utah is in the Center of the Fastest Growing Region in the Country Percent Change in Population for States: 1990 to 2009 U.S. Rate = 21.1% NH ME WA VT MA MT ND MN OR NY RI WI ID MI SD WY CT PA IA OH NE NJ IN IL NV UT WV VA CO DE MO KS KY CA NC TN MD SC OK AZ AR NM GA MS AL TX LA FL AK > 50% HI 25% to <50% 10% to <25% < 10% Source: U.S Census Bureau
> 500,000 100,000 to 499,999 20,000 to 99,999 < 19,999 State = 2,800,089 Utah Population by County: 2009 Cache 114,276 Rich 2,329 Box Elder 49,421 Utah’s population is centered upon the five large counties in the north-central part of the state. This is referred to as the Wasatch Front, as the population mass largely parallels the Wasatch Mountains that run from north to south on the eastern portion of these counties. These counties host 79% of Utah’s population on only 6% of Utah’s land mass. Because of this, Utah is considered an urbanized state. Only St. George in Washington County offers an urban mass off the Wasatch Front. It is one of the fastest growing counties in the United States, and has been for the past two decades, although slowed recently by the 2007-2009 recession. Projections are that rapid population growth will resume once the economy regains its footing. See population projections: http://governor.utah.gov/dea/Projections/07ProjCountyandDistrict.pdf Weber 227,259 Morgan 9,947 Davis 307,656 Daggett 988 Summit 40,451 Salt Lake 1,042,125 Tooele 59,117 Wasatch 23,428 Duchesne 17,368 Uintah 31,291 Utah 531,442 Juab 10,191 Carbon 19,768 Sanpete 27,646 Emery 10,848 Millard 13,702 Grand 9,493 Sevier 20,773 Beaver 6,576 Piute 1,479 Wayne 2,692 Iron 46,825 Garfield 5,149 San Juan 15,643 Kane 6,740 Washington 145,466 Source: Utah Population Estimates Committee
Increase of 4.0% or greater Increase of 2.7% to 3.9% Increase of 1.0% to 2.6% Change of less than 1.0% State Average = 1.5% Utah Population Growth Rates by County: 2008 to 2009 Cache 2.2% Rich 2.2% Box Elder 1.5% Population has been growing rapidly in the periphery counties surrounding the Wasatch Front. As the population grows, more people are making the decision to live further from the metropolitan mass and commute into the area for work. However, the schematics of this map for this year do not show that pattern. That is the pattern of the past two decades, but is not the pattern for last year. The recession of 2007-2009 has slowed the amount of population expansion in Utah, and thus the patterns of the past decade are being paused (probably not shuttered) by this slowdown. In the southwest corner, Washington County was ranked as one of the fastest growing counties in the nation. But the 2007-2009 recession put a major crimp in the Washington County economy, and an economy that was consistently one of the nation’s fastest growing just barely produced any population growth for 2009. Weber 1.2% Morgan 3.1% Davis 1.9% Daggett 2.5% Summit 1.3% Salt Lake 1.1% Tooele 1.6% Wasatch 2.6% Duchesne 3.6% Uintah 2.8% Utah 2.3% Juab 1.5% Carbon -0.4% Sanpete 2.5% Emery 2.2% Millard 1.1% Grand 1.8% Sevier 0.7% Piute 2.2% Beaver 0.8% Wayne 2.1% Iron 1.0% Garfield 2.1% San Juan 2.9% Kane 1.2% Washington 0.5% Source: Utah Population Estimates Committee
Utah’s Largest Cities: 2009 Logan Tremonton Brigham City Utah’s cities are concentrated along the Wasatch Front. You may notice that large expanses of Utah are thinly populated. Close to 80% of Utah’s land mass is owned by the government; mostly the federal government. These lands include military bases and ranges, Bureau of Land Management domains, National Parks and Monuments, National Recreation areas, National Forests, and Indian Reservations. Current population growth suggests that land and water availability may become issues several decades from now in Utah. Ogden Layton Bountiful Salt Lake City West Valley City Park City Tooele Sandy West Jordan Heber City Lehi Orem Vernal Provo Roosevelt Spanish Fork Payson Nephi Price Delta Ephraim Fillmore Richfield Moab Beaver Monticello Panguitch Cedar City Blanding St. George Kanab Source: U.S. Census Bureau
State of Utah Components of Population Change Due to a high birth rate, Utah’s population continually grows, even during periods of out-migration. Within the last 15 years, in-migration is consistent and persistent, even during the early 2000 period of a rare Utah employment recession. In the past, slow economic periods had produced net out-migration. Hispanic in-migration has been the changing factor in the post-1990 period. However, the 2007-2009 recession has virtually halted net migration into the state. Source: Utah Population Estimates Committee
Utah Population Percentages by Age Group 2009 Utah has the nation’s youngest population, with a median age of 28.9. The national median is 36.8. To get a feel for how young Utah is and the contrast, the next closest state is Texas, with a median age of 33.1. 0-9 10-19 20-34 35-44 45-54 55-64 65+ Source: U.S. Census Bureau, American Community Survey
U.S. Population by Age and Sex: 2005 Utah’s Population by Age and Sex: 2005 Male Female Male Female Millions Baby Boom Generation This population tree gives a visual of the difference between Utah’s age profile against the United States. The Baby Boom generation, denoted in red, dominates the national profile. Utah’s population, on the other hand, is dominated by 20 to 30 year olds. Utah produced a second baby boom in the 1980s. That generation is producing a third baby boom, whose beginning can be seen at the bottom of the Utah tree. As each Utah branch will move up one level by the 2010 Census, another significant branch should be added to Utah’s bottom, reflecting more children born between 2005 and 2010 by that 1980 baby boom generation. This chart will be seen again and used as an explanation for other Utah-specific economic phenomenon. Source: U.S. Bureau of the Census, American Community Survey
Utah State Employment Growth Rates 1950 – 2010f Utah has averaged 3.2% yearly employment growth since 1950. Only four other states have performed better. Strong population growth is the underlying key to Utah’s consistent employment growth. A rare employment recession occurred in 2002, with fewer jobs recorded than in 2001. One has to go back 38 years—to 1964—to find the last time Utah had fewer jobs in a succeeding year. The credit crunch of 2007-2009 has hit Utah even harder, with the most employment losses in the post-WWII era. Employment is expected to slowly rebound in 2010, but not enough to overcome a second straight year of employment loss. 3.2% average since 1950 2010 1950 1960 1970 1980 1990 2000 Source: Utah Department of Workforce Services: October 2010 f = forecast
Utah Employment(seasonally adjusted) Employment Employment losses for the 2001-2003 downturn, and the current downturn can be seen on this chart. The employment losses for the current downturn are much deeper than during the dot com downturn. 00 01 02 03 04 05 06 10 07 08 09 Source: U.S. Bureau of Labor Statistics; September 2010
Utah Employment 1939 - 2010 40 50 60 70 80 90 00 10 Source: U.S. Bureau of Labor Statistics; September 2010
Utah Employment 1950 – 2011f Average per year: 3.2% The worst Utah economic downturn in the post-WWII era. 50 60 70 80 90 00 10 Source: U.S. Bureau of Labor Statistics; September 2010 f = Utah Department of Workforce Services forecast.
Seasonally Adjusted Unemployment Rates 1999 - 2010 Source: U.S. Bureau of Labor Statistics: September 2010
Year-Over Percent Change In Non-farm Jobs Utah enjoyed a large employment boom coming out of the early 2000s dot.com recession. Demographics fueled this growth, as a huge wave of native born Utahns of the 1980s became of labor force age throughout this decade. Their entrance into the labor force propelled Utah’s economic boom, allowing Utah’s economy to grow nearly three times higher than the national rate. But the strong recession of 2007–2009 derailed the Utah economy, and what once soared higher than the national average fell below the national average in percentage job losses. It is anticipated that this lower-than-the-national-average position for Utah will be only temporary. As the economy stabilizes, Utah’s unique demographic factors should re-emerge to give Utah its normal economic boost. Source: Utah Department of Workforce Services: September 2010
Utah Percentage Change in Employment Overall – Housing-Related The boom in housing and the related industries that feed off housing growth and wealth were a significant part of the overall economic boom of the mid 2000s. The subsequent crash in housing related activity is quite rapid and sharp, and is a major contributor to the overall job loss picture in Utah. Housing-Related Overall 05 02 07 08 09 03 04 06 10 Source: Utah Department of Workforce Services
Stretching the economy to accommodate new workers Stretching the economy to accommodate new workers U.S. Population by Age and Sex: 2005 Utah’s Population by Age and Sex: 2005 Male Female Male Female Worker Vacuum Worker Vacuum Millions Dominating the Labor Force We’re back to this chart again. You can see the large number of 20 to 30 year olds in Utah. They made their labor force entrance throughout the 2000s first decade, and are the prime reason why Utah’s economy boomed in the mid 2000s. Source: U.S. Bureau of the Census
Utah Employment And Population Percentage Change 2000 - 2009 This chart also shows that the internal labor force was not the only factor at work. Utah’s population was also growing throughout the decade while job growth was basically non-existent from 2001 through 2003. The rebound out of that recession was strong because the economic supply is trying to catch up with the amount of population growth and its resultant consumer demand. Is that process repeating itself on possibly an even greater scale in the current recession? Population is still expanding, but yet notice the amount of job loss. That imbalance can exist for a short period, but at some point the economy will have to expand to put the population-jobs mix back in balance. 00 01 02 03 04 06 07 08 09 05 Source: Utah Dept. of Workforce Services, Utah Population Estimates Committee
Utah Residential Dwelling Unit Approvals 1995 – 2010 Dwelling Units Utah had a housing boom that started in 2003. This not only corresponded with the large number of new household formations in the state, but also the low mortgage and loose credit activity that characterized that time frame. Home permitting rose to an historic high in 2006. The collapse came in 2007 when the national credit crisis shut down lending and raised interest rates. A housing price run up from 2005 to 2007 added to the problem, as now high house prices and higher mortgage rates equated to non-affordability in Utah’s housing market. The situation will not be rectified until Utah house prices decline to a level akin to where they were before all this euphoria. Trendline Source: Bureau of Economic and Business Research, University of Utah; September 2010. http://www.business.utah.edu/display.php?pageId=1137
Utah Nonresidential Construction Valuation 1994 – 2010 (thousands of $) Nonresidential building trends usually lag residential trends by about two years. That shows forth here. Whereas Utah’s residential spike got underway in 2003, we see here the nonresidential climb beginning in 2005. The high point was reached in 2008, roughly two years after the residential spike. Even with the presence of the large NSA computer center proposed for southern Salt Lake county beginning in late 2010, nonresidential construction is expected to be lethargic in Utah for the next several years. Trendline LDS Conference Center IHC Hospital Grand America Hotel City Creek Micron Source: Bureau of Economic and Business Research, University of Utah; September 2010. http://www.business.utah.edu/display.php?pageId=1137
Wage Appreciation 22% 21% 18% 16% 26% Source: Utah Department of Workforce Services Utah Housing Price Appreciation Across Selected Metropolitan Areas 2002 - 2007 Salt Lake City 58% Provo-Orem 51% Ogden-Clearfield 41% Logan 33% St. George 73% Source: Office of Federal Housing Enterprise Oversight The environment is not going to change until housing affordability comes back into balance. Like much of the rest of the nation, Utah’s housing prices appreciated excessively over a five-year span, largely because a huge (and in hindsight questionable) decline in mortgage rates allowed home prices to rise steeply without compromising affordability. Once the mortgage rates returned to more historic levels, they now coupled with the new housing prices to suddenly equate to non-affordability. Since interest rates are not expected to go back down to their recent lows, the only thing that has to give in order to return to affordability is housing prices. They need to come down, possibly by as much as 20%. The only other option is for the housing market to sit dormant for 10 years waiting for wage appreciation to lift affordability. That is not likely to happen.
Utah Employment By Age 2009 Percent of the Labor Force Utah’s labor force is populated with young workers. 15-24 25-34 35-44 45-54 55-64 65+ Age Groups Source: U. S. Census Bureau, LED data.
15-34 Year-Old Percentage of Total 15+ Population Utah has a young population, and that effect is evident in the labor force. 48% of Utah’s labor force is younger than 35 years of age. No other state breaks 40%. Utah stands alone in this profile. Its young labor force is in stark contrast to the national labor force, which is Baby Boomer dominated. Source: Census Bureau, 2000 Census
Utah Employment By Age 2000, 2009 Percent of the Labor Force Utah was even younger at the beginning of this decade. This is a comparison of Utah’s labor force breakdown in 2000, then again in 2009. In 2000, the 15-24 year group had the most workers. Nine years later, aging has now shifted it to the 25-34 year group. Yet the youngest age group is still a prevalent proportion of the labor force. Five and ten years from now, Utah’s labor force will be even older, and the volume may shift further right. But after that, another young wave will come on (being born during the past ten years), and the average labor force age will decline once again. 2000 2009 15-24 25-34 35-44 45-54 55-64 65+ Age Groups Source: U. S. Census Bureau, LED data.
Utah Employment By Age: Urban and Non-Urban 2009 Percent of the Labor Force Though Utah is young, it is younger in the urban counties than in its non-urban counties. 15-24 25-34 35-44 45-54 55-64 65+ Age Groups Urban counties included Cache, Davis, Iron, Salt Lake Summit, Tooele, Utah, Wasatch, Washington, and Weber. Source: U. S. Census Bureau, LED data.
Utah Employment by Age Group: 2009 We’ve just seen that Utah is young. Much has been made nationally about the impending retirement of the Baby Boom generation and the loss of mass quantities of labor and knowledge. But Utah does not show much vulnerability to the Baby Boom retirement. The initial portion of that cohort only accounts for 11.5% of Utah’s labor force. That percentage should easily be dealt with and replaced within the Utah economy. 11.5% of total Source: U.S. Census Bureau; LED data. Note: Does not include federal government employment and other employment not covered by unemployment insurance regulations.
Industry’s With Higher Concentration of Older Workers 55-64 as a % of Total Employment in that Industry; 2009 Percent Although the Utah economy as a whole is not vulnerable to mass labor loss with Baby Boomer retirements, the industries illustrated here do have some degree of exposure with this age group as an influential proportion of their labor makeup. Source: Census Bureau, LED data. Used only industries with an employment threshold of 2,000 or more total workers.
Utah Female Employment: 2009Top 6 Industries Over time, females have claimed more of a presence in the labor force. This is both a national and a Utah phenomenon. Utah’s female labor participation rate is several percentage points higher than the national average. This graph illustrates the industries that employ the most female workers. Food Services NAICS 722 Ambulatory Healthcare NAICS 621 Hospitals NAICS 622 Banks Credit Mortgages NAICS 522 Professional Scientific Technical NAICS 541 Administrative Support NAICS 561 Source: U.S. Census Bureau; LED data. NAICS = North American Industry Classification System Note: Does not include federal government employment and other employment not covered by unemployment insurance laws.
Utah’s unemployment rate hit an historic low of 2.3% in Feb. 2007. This makes for a fully-employed labor force, resulting in strong upward pressure on wages. Since then, the Utah economy has weakened, and unemployment has moved higher, reaching levels in late 2010 not seen since the 1980s. Although the employment losses will turn out to be much worse in the 2007-2009 recession than in the early 1980s, unemployment will not rise as high. Why? Back in the early 1980s there was an incredible wave of Baby Boomers trying to find entrance into the labor force in the face of a slow economy. In the current environment, even though the job losses are higher, there are still not as many idle and unabsorbed workers as was seen nationally back in the early 1980s. Utah Unemployment Rate 1973 – 2010 Percent Source: U.S. Bureau of Labor Statistics: September 2009
Utah and the United States Nonagricultural Employment by Industry: 2009 Utah’s industrial mix is very much like the national distribution. Therefore, one concludes that Utah has a diverse economy. Some of the modest but noticeable differences are found in construction, manufacturing, education and health services, and government. One might expect Utah’s leisure and hospitality (a proxy for tourism) employment to be higher, as Utah is often thought of as a tourism state with its ski resorts and national parks, but that industry’s employment is actually below the national average. Sources: U.S. Bureau of Labor Statistics; Utah Department of Workforce Services
Leisure & Hospitality Employment by County: 2009 As a Percent of Total County Employment Cache 7.5% Rich 23.4% The leisure and hospitality industry is generally tagged as a proxy for the tourism industry. It includes hotels and restaurants, along with arts, entertainment, and recreation facilities. At 9.2% of all employment, this industry is important in Utah, but with the national average being 10.0%, it is no more important to the Utah economy than it is to any other state’s economy. That changes however, when you talk about individual counties. In Utah, there are counties whose economies are extremely dependent upon the tourism industry. They are presented as counties highlighted in red. In some cases, skiing is the attraction. In many southern counties, it is national parks that provide the main draw. In a few small counties, it is just a busy highway that brings travelers through along with their incidental purchases. Box Elder 7.7% Greater than 12% Less than 12% Weber 9.0% Morgan 9.4% Davis 9.5% Summit 36.0% Daggett 30.1% Salt Lake 8.2% Tooele 8.2% Wasatch 20.6% Duchesne 5.3% Uintah 7.4% Utah 7.6% Juab 8.9% Carbon 8.3% Sanpete 6.5% Emery 7.2% Millard 8.8% Grand 34.2% Sevier 11.0% Beaver 15.4% Wayne 20.2% Piute 15.9% Iron 11.9% Garfield 37.0% San Juan 15.1% Kane 29.1% Washington 14.2% Source: Utah Department of Workforce Services
Utah Employment By Establishment Size 2009 Percent A small number of employers employ a huge proportion of Utah’s workers. Nearly 60% of all Utah establishments employ fewer than five workers. They employ only 6% of the labor force. At the other end of the spectrum, only 2% of Utah’s employers employ more than 100 workers, but those that do employ 43% of all Utah workers. Large firms dominate Utah’s employment environment. Fewer than 5 5-9 10-19 20-49 50-99 100+ Employment-size Class Source: Utah Department of Workforce Services
Construction Employment Percent Change 1990 – 2009 Percent Construction employment growth can be very erratic in Utah, as this chart shows. Expansions can rapidly turn into contractions. The current downturn was both swift and deep (the bottom has not been reached yet). 90 95 00 05 10 Source: Utah Department of Workforce Services; September 2008
Top Utah Manufacturing Employment Industries 2009 Employment Transportation Equip. Fabricated Metal Products Misc.* Computer & Electronic Products Chemicals Food Source: Utah Department of Workforce Services * Largest areas are medical equipment and sporting goods
Utah High Technology Employment January 2001 – March 2010 High Technology is one of those hybrid industries which doesn’t have its own industrial (NAICS) code, but instead is a combination of subjectively-chosen NAICS codes. Utah’s technology sector suffered just like it did in all other states during the dot.com bust of the early 2000s. The technology sector has made a rebound since then, surpassing the previous employment high of 2001. Yet, the 2007-2009 recession subjected it to another employment setback. Employment 03 04 05 01 02 09 10 07 06 08 Source: Utah Department of Workforce Services. High Technology definition formulated by the Utah Governor’s Council of Economic Advisors.
Top Utah High-Technology Employment Industries 2009 Employment Computer Systems Design Aerospace Engineering Services Medical Equipment Mfg. Electronic Instrument Mfg. Software Source: Utah Department of Workforce Services
Life Sciences Employment January 2001 – March 2010 Employment Life Sciences is another one of those hybrid industries which doesn’t have its own NAICS code, but instead is a combination of subjectively-chosen NAICS codes. There is some overlap here with the high technology definition. The Life Sciences industry in Utah has been a consistently growing industry, even growing during the recession period of 2001 – 2003. Life Sciences makes up just over 2% of all Utah employment. 03 04 05 09 01 02 10 07 06 08 Source: Utah Department of Workforce Services. Life Sciences is an economic cluster as identified by the Governor’s Office of Economic Development.
Information Technology is another one of those hybrid industries which doesn’t have its own NAICS code, but instead is a combination of subjectively-chosen NAICS codes. There is some overlap with the high technology definition. The Information Technology industry in Utah has had its ups and downs, declining during the recession period of 2001 – 2003, then coming close to re-attaining the employment level of 2001 by late 2008. The 2007-2009 recession has given it another setback. Information Technology makes up about 3.5% of all Utah employment. Information Technology Employment January 2001 – March 2010 Employment 03 04 05 01 02 09 10 07 06 08 Source: Utah Department of Workforce Services. Information Technology is an economic cluster as identified by the Governor’s Office of Economic Development.
Energy/Natural Resources Employment January 2001 – March 2009 Employment Energy/Natural Resources is another one of those hybrid industries. Energy development can be a volatile industry, susceptible to strong market fluctuations. The energy industry enjoyed a boom from 2005 through the end of 2008. Then prices dropped dramatically at the start of 2009, as did employment. Energy/Natural Resources makes up less than 2% of all Utah employment. 03 04 05 01 02 10 09 07 06 08 Source: Utah Department of Workforce Services. Energy/Natural Resources is an economic cluster as identified by the Governor’s Office of Economic Development.
Greater than 200,000 100,000 to 199,999 20,000 to 99,999 Less than 20,000 State = 1,188,788 Utah Employment by County: 2009 Cache 49,032 Rich 708 Box Elder 18,352 Weber 91,003 Like its population, Utah’s employment is concentrated. Salt Lake County alone has 48% of all the jobs in Utah. Salt Lake County has more jobs than it does workers in the labor force. Large amounts of commuting from surrounding counties makes this possible. If Utah, Davis, Weber, and Cache counties are combined with Salt Lake County, this corridor accounts for 83% of all employment. Washington County, in the southwest corner, is the only other large metropolitan area not in proximity to the northern Utah metropolitan conglomeration. Morgan 1,832 Davis 99,911 Summit 20,774 Daggett 408 Salt Lake 573,449 Tooele 15,445 Wasatch 5,888 Duchesne 7,770 Uintah 13,321 Utah 175,387 Juab 3,282 Carbon 9,575 Sanpete 7,202 Emery 3,694 Millard 3,873 Grand 4,516 Sevier 7,813 Beaver 2,178 Piute 314 Wayne 1,053 Iron 15,645 Garfield 2,256 San Juan 4,118 Kane 2,996 Washington 46,994 Source: Utah Department of Workforce Services
Utah Employment Change by County: 2007 - 2009 The 2007-2009 recession took its toll upon Utah employment. The state lost 5% of its jobs across that two year period. Some counties were hit harder than others. One of the hardest hit was Washington County. There was a common theme across the United States in this recession. The areas that had the biggest housing bubbles were the areas that crashed the hardest. The St. George area (Washington County) was Utah’s area with the largest housing bubble. Although the entire state had a housing bubble larger than the national average, Washington County was Utah’s poster child. Its housing market performed more like the Las Vegas market. Meaning the bubble was larger, it burst a year before the rest of the state did, and the employment contraction was worse than was generally seen across the rest of the state. 0% and above Cache -1.8% Rich -6.0% -4.9% to 0% Box Elder -9.7% -9.9% to -5.0% -10.0% and less Weber -5.3% State Average = -5.0% Morgan -7.8% Davis -3.5% Daggett -16.2% Summit -5.1% Salt Lake -4.6% Tooele -0.4% Wasatch -17.1% Duchesne 5.3% Uintah -6.6% Utah -5.7% Juab -10.4% Carbon 3.5% Sanpete -4.2% Emery -5.4% Millard -2.9% Grand -3.1% Sevier -3.0% Beaver 6.1% Piute -11.8% Wayne -2.0% Iron -7.9% Garfield -3.6% San Juan -3.0% Kane -6.1% Washington -12.2% Source: Utah Department of Workforce Services
Utah Payroll Wages by Major Industry Group 2009 Total Payrolls in Thousands of $ Payroll wages are the primary source of income in Utah. Presented are the total payrolls generated by each industry sector. Natural Resources $821.8 Construction $2,882.1 Manufacturing $5,366.5 Trade, Trans., Utilities $8,094.3 Information $1,415.6 Financial Activities $3,386.8 Prof., and Business $6,880.0 Education and Health $5,280.7 Leisure and Hospitality $1,718.1 Other Services $943.7 Government $8,565.2 Source: Utah Dept. of Workforce Services
Utah Employment and Wages As a Percent of Total by Major Industry Group 2009 There can be a contrast between how much an industry contributes to total employment, and how much to total wages. For example, the leisure and hospitality industry accounts for 9.2% of all employment, but only 3.8% of payrolls. That industry is characterized with both low wages and high part-time employment. Percent of Total 1.2% Natural Resources 1.8% 5.9% Construction 6.4% 9.5% Manufacturing 11.9% 19.6% Trade, Trans., Utilities 17.9% 2.5% Information 3.1% Industries like manufacturing, financial activities, and professional and business services—because of high wages—contribute a higher percentage to total payrolls than they do to total employment. 6.0% Financial Activities 7.5% 12.6% Prof., and Business 15.2% 12.7% Education and Health 11.7% 9.2% Leisure and Hospitality 3.8% 2.9% Other Services 2.1% 18.1% Government 18.9% Employment Payroll Wages Source: Utah Dept. of Workforce Services
Utah Average Monthly Wage by Major Industry Group 2009 Natural Resources $4,532 Construction $3,407 Manufacturing $3,962 Trade, Trans., Utilities $2,884 Information $3,991 Financial Activities $3,971 Prof., and Business $3,835 Education and Health $2,917 Pay varies across industries, and that pay is largely dictated by the nature of the industry and what it demands from the labor force. For example, the leisure and hospitality industry doesn’t ask much in skill requirements from the labor force, and in turn doesn’t have to pay high prices for labor. Generally, the more an industry asks in specific skills, the more it must pay. Leisure and Hospitality $1,292 Other Services $2,311 Government $3,325 Source: Utah Dept. of Workforce Services
Utah Average Annual Pay as a Percent of the U.S. Average This illustrates Utah’s average annual pay—as measured through payrolls—compared against the United States average. As you can see, the Utah percentage has deteriorated over time. At first glance, one probably concludes that Utah’s wages have gotten worse. Some have speculated that it is the loss of high-paying natural resource jobs over time. Others just conclude that Utah has low paying jobs. The loss of high-paying natural resource-based jobs probably explains the deterioration between the early 1980s to the late 1990s. Thereafter, the decline is a demographic difference. The next slides will explain the demographic difference. Source: U.S. Bureau of Labor Statistics
U.S. Population by Age and Sex: 1980 Utah’s Population by Age and Sex: 1980 Male Female Male Female Millions Baby Boom Generation This is Utah and the United States in 1980. Notice how both area’s labor force is dominated by Baby Boomers. The U.S. average wage was influenced by young, lower-paid workers just finding their way into the labor force. Same situation with Utah. No wonder the Utah and U.S. averages were very close at the beginning of the previous slide. Source: U.S. Bureau of the Census
U.S. Population by Age and Sex: 2005 Utah’s Population by Age and Sex: 2005 Male Female Male Female Millions Dominating the Labor Force But now look what we have in the present. The U.S. is still dominated by the Baby Boom generation, but they have aged. Through tenure and advancement, they have risen into their highest-earning years. But notice Utah. It’s Baby Boom produced another baby boom, which is just at the beginning of its labor force journey. Utah’s labor force is dominated by young, lower-paid workers, while the U.S. is dominated by older, higher-paid workers. Take a room full of 30 year olds (a proxy for Utah) and a room full of 50 year olds (a proxy for the U.S.) and calculate the average wage for each. You will find the 50 year old room makes more money because of tenure and experience. This is a major reason why Utah’s average wages are low compared to the rest of the nation; it’s because we are so young. We see this youth as a positive for Utah, not a negative, especially as companies search for young labor with the impending retirement of the Baby Boomers nationwide. Source: U.S. Bureau of the Census, American Community Survey
1990 to 2000 Population Growth by County Source: U.S. Census Bureau.
2000 to 2009 Population Growth by County Source: Utah Population Estimates Committee; Utah Governor’s Office of Planning and Budget.
2008 to 2009 Population Growth by County Source: Utah Population Estimates Committee; Utah Governor’s Office of Planning and Budget.
Annual 2009 Change in Nonfarm Jobs Source: Utah Department of Workforce Services; U.S Bureau of Labor Statistics.