Download
1 / 38
380 likes | 474 Vues
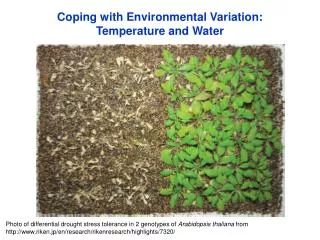
This comprehensive study focuses on coping mechanisms of living organisms when faced with changes in temperature and water availability. Explore how species adapt through stress tolerance, avoidance techniques, and evolutionary strategies to thrive in diverse ecological niches.

E N D
Coping with Environmental Variation: Temperature and Water Photo of differential drought stress tolerance in 2 genotypes of Arabidopsis thaliana from http://www.riken.jp/en/research/rikenresearch/highlights/7320/
The Ecological Niche Key niche dimensions include: Energy availability Availability of other resources Physical conditions (e.g., pH) Figure from Bruno et al. (2003) Trends in Ecology & Evolution
Generalists & Specialists Two species with the same niche breadths along both niche axes Water Availability (resource & physical condition) Species 1 Species 2 Temperature (C)
Generalists & Specialists Species 1 has a narrower niche breadth along both niche axes Water Availability (resource & physical condition) Species 1 (Specialist) Species 2 (Generalist) Temperature (C)
Generalists & Specialists Individuals with much narrower niche breadths than their respective populations Water Availability (resource & physical condition) Species 1 Specialist? Species 2 Generalist? Individual Temperature (C)
Stress Tolerance Range of environmental tolerances helps determine potential geographic distribution (fundamental niche) Photo of saguaro in Sonoran Desert and range map from Wikimedia Commons
Tolerance & Avoidance of Stress To reduce exposure to, or consequences of, environmental stress: physiological changes, e.g., drought deciduousness Photo of dry season Tabebuiaaureafrom Wikimedia Commons
Tolerance & Avoidance of Stress To reduce exposure to, or consequences of, environmental stress: behavioral/physiological changes, e.g., dormancy (highly reduced metabolic activity), torpor (reduced met. & temp. in animals), hibernation (extended torpor); winter sleep / denning (extended sleep with slight reduction in temp.) Hibernating northern bat in Norway from Wikimedia Commons
Tolerance & Avoidance of Stress To reduce exposure to, or consequences of, environmental stress: behavior, e.g., migration Migration routes for some champion avian migrants from Wikimedia Commons
Acclimatization Usually reversible physiological, morphological or behavioral adjustment by individuals to reduce stress (under lab conditions = acclimation) Photo of Mt. Everest base camp from https://studentadventures.co.uk/adventures/everest_base_camp_trek
Adaptation Ecotypes are populations adapted to local conditions Image re Clausen, Keck & Heisey’s (1948) classic study from http://www2.nau.edu/~gaud/bio300w/ecotype.htm
Temperature Enzymes have physical optima Isozymes’ optima differ Denature at high temp. Lower activity limit -5 C Image from https://wikispaces.psu.edu/pages/viewpage.action?pageId=112526688&navigatingVersions=true
Temperature Influences the properties of biological membranes Image of cell membrane from Wikimedia Commons
Thermal Energy Balance (Plants) Energy input vs. energy output determines an object’s heat energy change (and internal temp.) Hplant Cain, Bowman & Hacker (2014), Fig. 4.8
Thermal Energy Balance Boundary layer lowers convective heat loss Cain, Bowman & Hacker (2014), Fig. 4.11
Thermal Energy Balance (Animals) Ectotherm– regulates temp. through energy exchange with environ. Hectotherm Endotherm – relies primarily on internal heat generation Hendotherm Photos of basking snake and weasel from Wikimedia Commons
Thermal Energy Balance (Animals) Cain, Bowman & Hacker (2014), Fig. 4.16 A
Properties of Water Maximum density at 3.98 C High heat capacity – ratio of change in heat energy to change in temperature Photo of water in 3 physical phases from Wikimedia Commons
Properties of Water Universal solvent for biologically important solutes “Water is the medium in which all biochemical reactions necessary for physiological function occur” Quote from Cain, Bowman & Hacker (2014), pg. 98; photo of bacteria grown from Lake Whillans(beneath Antarctic ice sheet) from http://www.nature.com/news/lakes-under-the-ice-antarctica-s-secret-garden-1.15729
Water and Biology Organismal water content for normal physiology 60% to 90% of body mass Salt balance is intimately tied to water balance Infra-red camera trap photo of bat at Peruvian mineral lick from http://news.mongabay.com/2008/0714-hance_bats_atbc.html
Water Potential Flows along potentialenergy gradients (high to low) Gravitational potential – owing to gravity o = Osmotic potential – negative, owing to solutes p= Pressure (turgor) potential – positive, owing to pressure (negative if under tension) m= Matric potential – negative, owing to attractive forces on surfaces (e.g., large molecules, soil particles) Water potential = o + p + m Resistance – force that impedes movement of water (its reciprocal is conductance)
Water Potential & Transpiration Daytime – decreasing water potential gradient from soil, through terrestrial plant, to atmosphere Cain, Bowman & Hacker (2014), Fig. 4.20
Allocation Tradeoff Root-shoot ratio Cain, Bowman & Hacker (2014), Fig. 4.22
Water & Salt Balance in Teleost Fishes seawater < teleost < freshwater Hyperosmotic Hypoosmotic Cain, Bowman & Hacker (2014), Fig. 4.24
Water & Salt Balance in Terrestrial Animals Exchange gases in dry environment (low water potential) Some adaptations to lower evaporative loss & water stress: High skin resistance Habitat selection (sufficient water to replace losse) Metabolic water High renal efficiency Image of camels in Chad from Wikimedia Commons
Allometry Many scaling relationships can be expressed as power laws: Y = c Xs X is the independent variable – measured in units of a fundamental dimension; c is a constant of proportionality; and s is the exponent (or “power” of the function) The relationship is a straight line on a log-log plot: Log10(Y) = Log10(c) + s Log10(X) …and by rearranging, this is the form of the familiar equation for a straight line: y = mx + b
Allometry Consider the scaling of squares & cubes as functions of the length of a side (the fundamental dimension) Area = Length2 Area Length2 Surface area = 6 * Length2 Surface area Length2 Volume = Length3 Volume Length3
Allometry Y = X2 (accelerating function) Area Length
Allometry Y = X2 (accelerating function) Area Length
Allometry Y = X2 (accelerating function) Area Length
Allometry Y = X2 (accelerating function) Y = 2X Log10(Area) Area Length Log10(Length) Etc…
Allometry Y = 6 * X2 (accelerating function) Y = 2X + 0.778 Log10(Surface Area) Surface area Length Log10(Length) Etc…
Allometry Y = X3 (accelerating function) Y = 3X Volume Log10(Volume) Length Log10(Length) Etc…
Allometry Consider the ways in which surface area & volume of a sphere scale with its radius Surface area = 4 r2 Surface area r2 Volume = 4/3 r3 Volume r3
Allometry Surface-to-volume ratio: Surface area r2 Surface area1/2 r Volume r3 Volume1/3 r Surface area1/2 Volume1/3 Surface area Volume2/3
Allometry Slope = 1 Y=4.83 * X0.667 Y=0.667 * X + 0.68 Surface area Log10(Surface area) (decelerating function) Volume Log10(Volume) Volume increases proportionately faster than surface area Etc…
Allometry Slope = 1 Y=4.83 * X0.667 Y=0.667 * X + 0.68 Surface area Log10(Surface area) (decelerating function) Volume Log10(Volume) This simple fact has myriad important implications for biology (e.g., heat exchange) Etc…
Allometry Assuming ecotothermyand environmental ceteris paribus, which one warms up (or cools down) fastest? Paedophryneamauensis Image of dinosaurs and world’s smallest known vertebrate from Wikimedia Commons