Download
1 / 45
450 likes | 539 Vues
Explore advanced visualization techniques for finite element data of multi-phase concrete models, focusing on drying shrinkage simulation.

E N D
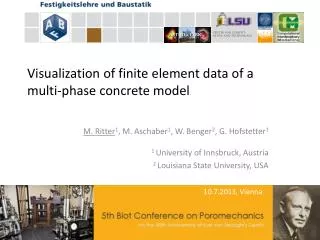
ASTRO@UIBK Center for Comput-ation and Technology Visualization of finite element data of a multi-phase concrete model M. Ritter1, M. Aschaber1, W. Benger2, G. Hofstetter1 1 University of Innsbruck, Austria 2 Louisiana State University, USA 10.7.2013, Vienna
Outline • Motivation • Numerical Simulation • Data Modeling • Visualization • Conclusion & Future Work
Motivation • Motivation: Engineering Simulation Tools and Visualization Scientific Visualization Techniques and Research by Neal Stone Gap
Motivation • Motivation: Engineering Simulation Tools and Visualization Scientific Visualization Techniques and Research by Neal Stone
Motivation • Motivation: • Simulation techniques are used more frequently • Produced data sets growing • Data complexity is increasing • Visualization used for data interpretation of results is important.
Numerical Simulation 10.7.2013, Vienna
Numerical Simulation • Aim: • More realistic simulation of drying shrinkage • Application: • Strengthening of a RC structure by adding an overlay New top concrete layer Old concrete structure
Numerical Simulation • Drying shrinkage: • Long term drying process in concrete • Decrease of relative pore humidity • Increase of capillary pressure • Capillary pressure results in volumetric shrinkage drying concrete
Numerical Simulation • Drying Shrinkage: New top concrete layer Old concrete structure Critical region at joint Different internal stresses Drying shrinkage Swelling concrete
Numerical Simulation • Numerical Simulation: • Finite element simulation on multiple grids of concrete specimen • Hexahedral Mesh of 9 x 9 x 13 Cells 100 x 100 x 56 mm
Numerical Simulation • Numerical Simulation: • Finite element simulation on multiple grids of concrete specimen • Hexahedral Mesh of 9 x 9 x 13 Cells Undeformed linear element Deformed quadratic element The element has curved faces
Numerical Simulation • Drying shrinkage • Effective stress: • Hydrostatic pressure of the water on the solid phase:
Data Modeling 10.7.2013, Vienna
Data Modeling Grid Field
Data Modeling • Hierarchical structure:
Fiber: 0D 1D 3D 6D Data Modeling Base: 3D 2D 1D 0D
Data Modeling • Data at Vertices: (optional) (optional)
Data Modeling • Data at Integration Points: No positions can be computed
Data Modeling • Sets of Nodes and Sets of Elements: Indices of vertices in named fragments Indices of integration points in named fragments
Data Modeling • Linked groups for alternative data access: • E.g. time frames and time steps in ABAQUS No data stored
Data Modeling FEM - Example HDF5 Based Data format: independent, free, open, data browser www.hdfgroup.org
Visualization 10.7.2013, Vienna
Visualization Shell VISH Visualization • Visualization framework • Highly modular design • Small Core • Plug-Ins • Mainly developed by Werner Benger • Currently about 8 people are actively contributing • C++, OpenGL • Open Academic License • Runs on Linux, Windows (and MacOS) • http://vish.fiberbundle.net
Visualization • Colored Cages • Show FE grid • Positive • Negative • Shaded colored surface • Illustrates data at vertices • One scalar field via color-map • One vector field via displacement • Can be combined with other visualization techniques
Visualization • Colored Cages • Integration point data is extrapolated and averaged on demand Extrapolation from integration points Over-scaled deformation Averaged, smoothed
Visualization • Tensor analysis: • Shape factors by [Westin97] • Stress/strain are3x3 symmetric tensors • 3 Eigen-Values: • Shape factors: [BBHKS06]
Visualization • Direct stress tensor visualization: • Ellipsoids representing the shape factors • Tensor Splats [BengerHege04] -> barycentric
Visualization • Direct stress tensor visualization: • Ellipsoids representing the shape factors • Tensor Splats [BengerHege04] Works only for positive Eigenvalues! -> barycentric
Visualization • Direct stress tensor visualization: • Ellipsoids representing the shape factors • Tensor Splats [BengerHege04] Works only for positive Eigenvalues! Enhancement: Color a splat in blue, when any Eigenvalues is negative -> barycentric [BBHKS06]
Visualization • Drying simulation: • Tensor splats: Biaxial tension Uniaxial tension Pressure region + Multiple stress directions + Tension vs pressure regions
Visualization • Scalar fields by volume rendering: • Texture based volume rendering ( requires resampling on uniform grid to be improved) • Shows inner structure of data fields • Example: tri-axial compression of a cuboid and Mises in ABAQUS and Misesvia volume rendering
Drying simulation: • After 30 days of drying • Volume rendering of drying shrinkage • Cages show an uplift of the corner and the edges
Dual volume rendering: • One scalar field controls color • Another controls transparency
Conclusion & Future Work 10.7.2013, Vienna
-The END- 10.7.2013, Vienna
Numerical Simulation • Balance equations of the multiphase model Mass of the water w Mass of the steam gw Mass of the dry air ga Mass of the solid phase s Enthalpy of the whole system Impulse of the whole system