Download
1 / 4
40 likes | 170 Vues
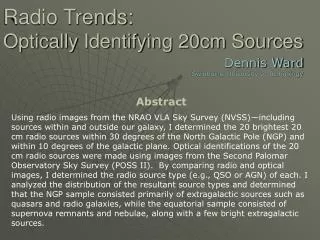
This research investigates the optical counterparts of the 20 brightest 20 cm radio sources identified within 30 degrees of the North Galactic Pole and 10 degrees of the galactic plane using images from the NRAO VLA Sky Survey (NVSS) and the Second Palomar Observatory Sky Survey (POSS II). We found a significant distinction between the source compositions of polar and equatorial samples, with the polar sample predominantly consisting of extragalactic quasars and galaxies, while equatorial sources mainly included supernova remnants and nebulae, revealing insights into the nature of these cosmic entities.

E N D
Radio Trends:Optically Identifying 20cm Sources Abstract Using radio images from the NRAO VLA Sky Survey (NVSS)—including sources within and outside our galaxy, I determined the 20 brightest 20 cm radio sources within 30 degrees of the North Galactic Pole (NGP) and within 10 degrees of the galactic plane. Optical identifications of the 20 cm radio sources were made using images from the Second Palomar Observatory Sky Survey (POSS II). By comparing radio and optical images, I determined the radio source type (e.g., QSO or AGN) of each. I analyzed the distribution of the resultant source types and determined that the NGP sample consisted primarily of extragalactic sources such as quasars and radio galaxies, while the equatorial sample consisted of supernova remnants and nebulae, along with a few bright extragalactic sources. Dennis WardSwinburne University of Technology
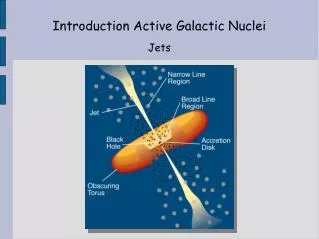
Introduction & Methods Introduction While radio surveys, such as the NVSS at 20 cm, provide valuable data on the position and strength of radio sources, it is often helpful to identify the optical counterpart of a given radio source so that the physical processes that power the radio source can be determined. In order to better understand the strongest radio sources observed by the NVSS, I undertook this project– optically identifying the 20 strongest 20 cm radio sources in two samples. Methods I determined the J2000 equatorial coordinates for the North Galactic Pole (NGP) along with the galactic equator and used the NVSS Source Catalog Browser to list bright radio sources within 30° of the NGP and ±10° from the galactic equator. The 20 brightest sources from each area were downloaded as images and contour plots from the NVSS Postage Stamp Server. Optical images for each target were then downloaded from STScI’s digitised POSS II archive. The optical sources were compared to the NVSS images, as shown in Figure 1, and identified by eye as SNR, QSO, galaxy, etc. These identifications were compared to the published identifications in the SIMBAD database. Figure 1. Supernova Remnant Cassiopeia A at Radio & Optical Wavelengths
Results As you can see in Figure 2, the two target samples—Equatorial and Polar—have significantly different compositions. The polar sample is made up of entirely of quasars and radio galaxies, aside from the 3 visually empty fields. Old halo stars are not bright radio sources, and therefore are not represented in this sample. The equatorial sample primarily consists of nebulae and supernova remnants, associated with young and short-lived stars. It also contains a few extragalactic sources that were bright enough to outshine all but the very brightest galactic ones. QSO = Quasar GAL = GalaxyEF = Empty Field NEB = NebulaSNR = Supernova Remnant Figure 2. Sample Compositions The equatorial sources outshine the polar ones by almost a factor of 10 and the top ten are all brighter than the strongest polar source, as shown in Figure 3. The equatorial sample is brighter because these objects are closer– they are galactic vs. extragalactic sources. Figure 3. Power Distribution of Radio Sources
Conclusions • What differences would be expected between the two samples? • The equatorial sample is directly in the plane of the galaxy, and as such, should contain mostly those objects that exist within our galaxy. • Evidence: Approximately 70% of the equatorial sample is made up of objects found inside our galaxy. SNRs and nebulae must be within our galaxy in order to be bright enough to show up on the POSS II plates. The other 30% of this sample is made up of quasars, empty fields, and a radio galaxy. • The lone galaxy in the equatorial list, M94, outshines all but the 13 sources stronger than it in the galactic plane. While SIMBAD identifies one of the three remaining empty fields as a QSO, the other two could either be extragalactic sources or perhaps faint SNRs located within our galaxy. • The polar sample, on the other hand, should be made up primarily of extragalactic objects, since they are located 60-90° from the galactic plane. • Evidence: The polar sample is made up entirely of extragalactic objects—9 quasars and 8 galaxies. • According to the SIMBAD database, the three empty fields are also extragalactic objects, 2 QSOs and a galaxy, too faint to register on the POSS II plates. • Both hypotheses are supported by the analyses.