Outlier Detection for Graph Data
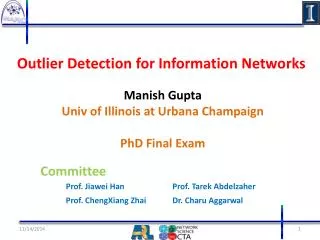
Outlier Detection for Graph Data. Manish Gupta. Jing Gao. Jiawei Han. Charu Aggarwal. Microsoft. SUNY. UIUC. IBM. Tutorial Outline. Introduction [10 min] Static Graph Outlier Detection Algorithms [45 min] Break [10 min] Dynamic Graph Outlier Detection Algorithms [45 min]


Outlier Detection for Graph Data
E N D
Presentation Transcript
Outlier Detection for Graph Data Manish Gupta Jing Gao Jiawei Han Charu Aggarwal Microsoft SUNY UIUC IBM
Tutorial Outline • Introduction [10 min] • Static Graph Outlier Detection Algorithms [45 min] • Break [10 min] • Dynamic Graph Outlier Detection Algorithms [45 min] • Summary [10 min] * Slides borrowed with permission from authors gmanish@microsoft.com, jing@buffalo.edu, charu@us.ibm.com, hanj@cs.uiuc.edu
Tutorial Outline • Introduction [10 min] • Static Graph Outlier Detection Algorithms [45 min] • Break [10 min] • Dynamic Graph Outlier Detection Algorithms [45 min] • Summary [10 min] gmanish@microsoft.com, jing@buffalo.edu, charu@us.ibm.com, hanj@cs.uiuc.edu
Outlier Detection • Also called anomaly detection, event detection, novelty detection, deviant discovery, change point detection, fault detection, intrusion detection or misuse detection • Three types • Techniques: classification, clustering, nearest neighbor, density, statistical, information theory, spectral decomposition, visualization, depth, and signal processing • Outlier packages: • Data types:high-dimensional data, uncertain data, stream data, network data, time series data Point Outliers Normal Outlier Contextual Outliers Collective Outliers gmanish@microsoft.com, jing@buffalo.edu, charu@us.ibm.com, hanj@cs.uiuc.edu
0.13 Information Network Analysis 0.6 ? 0.3 0.1 0.27 Clustering 0.41 Link Prediction Classification 0.54 0 0.11 0.2 0.7 0.2 0.01 0.1 0.8 0.7 0.9 Community Detection Influence Propagation PageRank gmanish@microsoft.com, jing@buffalo.edu, charu@us.ibm.com, hanj@cs.uiuc.edu
Outlier Detection for Information Networks Network Analysis Outlier Detection Outlier Detection For Networks gmanish@microsoft.com, jing@buffalo.edu, charu@us.ibm.com, hanj@cs.uiuc.edu
Need for Outlier Detection on Networks (Social Media Analysis) EXPERT MARKETER User Tag User Tag Fashion URL Fashion Video Arts Science Sports Arts Science Sports gmanish@microsoft.com, jing@buffalo.edu, charu@us.ibm.com, hanj@cs.uiuc.edu
Need for Outlier Detection on Networks • Distributed Systems • Data Integration Systems Intrusion Detection Link Failures Input/Output Correlation breach Civil Rights Movement Gandhi 1893-1914 Kasturba Gandhi X 1869-1944 X 1969 X Obama Entity Network 1889 1869 1961- gmanish@microsoft.com, jing@buffalo.edu, charu@us.ibm.com, hanj@cs.uiuc.edu
Challenges in Outlier Detection on Networks • Extraction of patterns • Across multiple node types • Across multiple types of node attribute data • Across time • Scale • Matching patterns across time • Modeling links and data together • Defining outliers given the patterns gmanish@microsoft.com, jing@buffalo.edu, charu@us.ibm.com, hanj@cs.uiuc.edu
Tutorial Outline • Introduction [10 min] • Static Graph Outlier Detection Algorithms [45 min] • Minimum Description Length [10 min] • Ego-net Metrics [5 min] • Random Walks [5 min] • Random Field Models [10 min] • Outliers in Heterogeneous Networks [15 min] • Break [10 min] • Dynamic Graph Outlier Detection Algorithms [45 min] • Summary [10 min] gmanish@microsoft.com, jing@buffalo.edu, charu@us.ibm.com, hanj@cs.uiuc.edu
Minimum Description Length (MDL) Principle • Best hypothesis for a given set of data is the one that leads to the best compression of the data • Any regularity in a given set of data can be used to compress the data • Given data , the best hypothesis to explain is the one which minimizes where • is the length, in bits, of the description of the hypothesis • is the length, in bits, of the description of the data when encoded with the help of the hypothesis • Outlier Detection: Find patterns using MDL; objects that do not fit the patterns are outliers gmanish@microsoft.com, jing@buffalo.edu, charu@us.ibm.com, hanj@cs.uiuc.edu
Chakrabarti PKDD’04 MDL for Graph Partitioning and Outlier Edge Detection People People Groups People People Groups • Goals • [#1] Find groups (of people, species, proteins, etc.) • [#2] Find outlier edges (“bridges”) • Similar nodes are grouped together • As few groups as necessary A few, homogeneous blocks Good Clustering Good Compression implies gmanish@microsoft.com, jing@buffalo.edu, charu@us.ibm.com, hanj@cs.uiuc.edu
MDL for Graph Partitioning and Outlier Edge Detection: Algorithm Iteratively reassign each node to the group which minimizes the code cost Find good groupsfor fixed k Start with initial matrix Lower the encoding cost Final grouping Choose k=k+1 Split group with maximum entropy per node; assign “bad” nodes to new group gmanish@microsoft.com, jing@buffalo.edu, charu@us.ibm.com, hanj@cs.uiuc.edu
Node Groups Node Groups MDL for Graph Partitioning and Outlier Edge Detection: Outlier Edges Outlier Edges Nodes Nodes Deviations from “normality” Lower quality compression Outliers Find edges whose removal maximally reduces cost gmanish@microsoft.com, jing@buffalo.edu, charu@us.ibm.com, hanj@cs.uiuc.edu
Noble and Cook, KDD’03 MDL for Anomalous Substructure Detection: Graph Based Anomaly Detection • Finding anomalous substructure is difficult because there are a lot many infrequent substructures • Method 1 • Anomaly is opposite of a pattern • Best substructure pattern is one that minimizes • is “intuitively” the opposite of • Low is anomalous • Method 2 • Subgraphs containing many common substructures are generally less anomalous than subgraphs with few common substructures • Use multiple iterations of Subdue to compress the graph • Outlier score should quantify how much and how soon graph is compressed • Where n is number of iterations, is percentage of subgraph that is compressed away on ith iteration gmanish@microsoft.com, jing@buffalo.edu, charu@us.ibm.com, hanj@cs.uiuc.edu
Entropy Measures of Graph Regularity (1) • How to identify if the graph is “regular enough” and does it contain any anomalous substructures? • Substructure Entropy • is defined as #instances of in /total #instances of all -vertex substructures • Given a regular graph with many common subgraph patterns, its entropy will be low • Entropy will depend on the space of all possible substructures (which depends on – size of any substructure) B C B C A Example Graph C A B B C C B A values for =2 1/5 2/5 1/5 1/5 gmanish@microsoft.com, jing@buffalo.edu, charu@us.ibm.com, hanj@cs.uiuc.edu
Entropy Measures of Graph Regularity (2) • Conditional Substructure Entropy • Given an arbitrary n-vertex substructure, how many bits are needed to describe its surroundings? • Surroundings can be thought of as a set of extensions to the substructure; we define an extension of a substructure to be the addition of either a single vertex (along with the edge connecting it to the substructure), or a single edge within the substructure. • Let be all vertex substructures in . then contains all substructures containing or vertices. will then be the percentage of instances of that extend to an instance of B C B C B C A If y = B B C And x= P(x|y)=1/2 gmanish@microsoft.com, jing@buffalo.edu, charu@us.ibm.com, hanj@cs.uiuc.edu
Eberle and Holder, ICDMW’07 Structural Anomalies in Graph Data • Problem: Given a graph in which nodes and edges contain (non-unique) labels, how to find substructures that are very similar to, though not the same as, a normative substructure? • Intuition: "The more successful money-laundering apparatus is in imitating the patterns and behavior of legitimate transactions, the less the likelihood of it being exposed." – United Nations Office on Drugs and Crime • Formal Problem: Given graph with a normative substructure , a substructure is anomalous if difference between and satisfies , where is a (user-defined) threshold and is a measure of the unexpected structural difference gmanish@microsoft.com, jing@buffalo.edu, charu@us.ibm.com, hanj@cs.uiuc.edu
Three Types of MDL-based Subgraph Anomalies • Subgraph patterns are obtained using the Graph Based Anomaly Detection (GBAD) tool based on SUBDUE algorithm • Three types of anomalies • GBAD-MDL (Minimum Descriptive Length): anomalous modifications • GBAD-P (Probability): anomalous insertions • GBAD-MPS (Maximum Partial Substructure): anomalous deletions • Note: Prone to miss more than one type of anomaly e.g., a deletion followed by modification gmanish@microsoft.com, jing@buffalo.edu, charu@us.ibm.com, hanj@cs.uiuc.edu
GBAD-MDL (Information Theoretic Approach) • Given a normative substructure , find similar but not exactly isomorphic substructures • For each instance in • Where is the cost to modify to gmanish@microsoft.com, jing@buffalo.edu, charu@us.ibm.com, hanj@cs.uiuc.edu
GBAD-P (Probabilistic Approach) • Given a normative substructure , find extensions to with lowest probability, (i.e., extend with vertices and edges with least probability) • For each instance in gmanish@microsoft.com, jing@buffalo.edu, charu@us.ibm.com, hanj@cs.uiuc.edu
GBD-MPS (Maximum Partial Substructure Approach) • Given a normative substructure , find ancestral substructures that are missing various edges and vertices • For each instance in gmanish@microsoft.com, jing@buffalo.edu, charu@us.ibm.com, hanj@cs.uiuc.edu
Anomalies in Real Datasets (Cargo Shipment Data) • Cargo Shipment Data: obtained from Customs and Borders Protection (CBP) • Scenario: Marijuana seized at Florida port [press release by U.S. Customs Service, 2000]. Smuggler did not disclose some financial information, and ship traversed extra port • GBAD-P discovers the extra traversed port • GBAD-MPS discovers the missing financial info • Network Intrusion Data: 1999 KDD Cup Network Intrusion • 100% of attacks were discovered with GBAD-MDL • 55.8% for GBAD-P and 47.8% for GBAD-MPS • Data consists of TCP packets that have fixed size • Thus, the inclusion of additional structure, or the removal of structure, is not relevant here • Modification is the only relevant one, at which GBAD-MDL performs well • High false positive rate! gmanish@microsoft.com, jing@buffalo.edu, charu@us.ibm.com, hanj@cs.uiuc.edu
Tutorial Outline • Introduction [10 min] • Static Graph Outlier Detection Algorithms [45 min] • Minimum Description Length [10 min] • Ego-net Metrics [5 min] • Random Walks [5 min] • Random Field Models [10 min] • Outliers in Heterogeneous Networks [15 min] • Break [10 min] • Dynamic Graph Outlier Detection Algorithms [45 min] • Summary [10 min] gmanish@microsoft.com, jing@buffalo.edu, charu@us.ibm.com, hanj@cs.uiuc.edu
Akoglu et al, PAKDD’10 Oddball: Outlier Detection using Ego-net Metrics (1) • For each node • Extract ego-net (=1-step neighborhood) • Extract features (#edges, total weight, etc.) • Features that could yield “laws” • Features fast to compute and interpret • Detect patterns • Regularities • Detect anomalies • Distance to patterns gmanish@microsoft.com, jing@buffalo.edu, charu@us.ibm.com, hanj@cs.uiuc.edu
Oddball: Outlier Detection using Ego-net Metrics (2) • Which features to compute • : Number of neighbors (degree) of ego • : Number of edges in Ego-net • : Total weight of Ego-net • : principal eigenvalue of the weighted adjacency matrix of Ego-net • Power laws • Ego-net Density Power Law: , • Ego-net Weight Power Law: , • Ego-net Power Law:, • Ego-net Rank Power Law: , where is the rank of edge j in the sorted list of edge weights gmanish@microsoft.com, jing@buffalo.edu, charu@us.ibm.com, hanj@cs.uiuc.edu
Oddball: Outlier Detection using Ego-net Metrics (3) • Outlier score for instance is the distance to the fitting power law curve gmanish@microsoft.com, jing@buffalo.edu, charu@us.ibm.com, hanj@cs.uiuc.edu
Oddball: Outlier Detection using Ego-net Metrics (4) gmanish@microsoft.com, jing@buffalo.edu, charu@us.ibm.com, hanj@cs.uiuc.edu
Ghoting et al, ICDM’04 Link-based Outlier and Anomaly Detection in Evolving Data Sets (LOADED) • Convert the multi-dimensional dataset with a few categorical and continuous attributes to a network dataset • Two data points are linked if they have at least 1 categorical attribute value in common • Association link strength = number of attribute-value pairs shared in common • Outlier score computation • A point with no links to other points will have the highest possible score • A point that shares only a few links, each with a low link strength, will have a high score • A point that shares only a few links, some with a high link strength, will have a moderately high score • A point that shares several links, but each with a low link strength, will have a moderately high score • Every other point will have a low to moderate score gmanish@microsoft.com, jing@buffalo.edu, charu@us.ibm.com, hanj@cs.uiuc.edu
LOADED Outlier Score Computation • Categorical data: • is a set in the powerset of all attribute-value pairs in • is the number of attribute value pairs in • is the number of points sharing the same attribute value pairs • is the minimum support (or minimum number of links) • Categorical+Continuous Data: • : at least % of correlation coefficients disagree with the distribution followed by the continuous attributes for point • : or hold true for every superset of in • The authors also propose a dynamic algorithm to maintain the counts and support of frequent itemsets for efficient outlier detection in evolving datasets gmanish@microsoft.com, jing@buffalo.edu, charu@us.ibm.com, hanj@cs.uiuc.edu
LOADED Performance on KDD-Cup 1999 Dataset gmanish@microsoft.com, jing@buffalo.edu, charu@us.ibm.com, hanj@cs.uiuc.edu
Tutorial Outline • Introduction [10 min] • Static Graph Outlier Detection Algorithms [45 min] • Minimum Description Length [10 min] • Ego-net Metrics [5 min] • Random Walks [5 min] • Random Field Models [10 min] • Outliers in Heterogeneous Networks [15 min] • Break [10 min] • Dynamic Graph Outlier Detection Algorithms [45 min] • Summary [10 min] gmanish@microsoft.com, jing@buffalo.edu, charu@us.ibm.com, hanj@cs.uiuc.edu
Moonesinghe et al, ICTAI’06 Outlier Detection Using Random Walks • Given a multi-dimensional dataset create a network dataset • OutRank-a: Use cosine similarity between objects as the edge weight • OutRank-b: Generate graph using cosine similarity and connect nodes only if cos-sim>threshold; on this graph, similarity between nodes is based on number of shared neighbors • Connectivity score is then computed similar to the Pagerankscore using power iterations • Outliers are nodes that are very weakly connected, i.e., ones with low connectivity scores gmanish@microsoft.com, jing@buffalo.edu, charu@us.ibm.com, hanj@cs.uiuc.edu
Outlier Detection Using Random Walks gmanish@microsoft.com, jing@buffalo.edu, charu@us.ibm.com, hanj@cs.uiuc.edu
such that edges are between and Neighborhood formation (NF) Problem Given a query node in , what are the relevance scores of all the nodes in to ? Anomaly detection (AD) Problem Given a query node in , what are the normality scores for nodes in that link to ? Sun et al, ICDM’05 Anomalies using Random Walks on Bipartite Graphs gmanish@microsoft.com, jing@buffalo.edu, charu@us.ibm.com, hanj@cs.uiuc.edu
Application Settings for Bipartite Graphs • Publication network • (similar) authors vs. (unusual) papers • P2P network • (similar) users vs. (“cross-border”) files • Financial trading network • (similar) stocks vs. (cross-sector) traders • Collaborative filtering • (similar) users vs. (“cross-border”) products gmanish@microsoft.com, jing@buffalo.edu, charu@us.ibm.com, hanj@cs.uiuc.edu
.3 .2 .05 .01 .002 .01 Neighborhood Formation on Bipartite Graphs Input: a graph and a query node Output: relevance scores to • Random-walk with restart from in • Record the probability visiting each node in • The nodes with higher probability are the neighbors V1 V2 q gmanish@microsoft.com, jing@buffalo.edu, charu@us.ibm.com, hanj@cs.uiuc.edu
Anomaly Detection on Bipartite Graphs • in is normal if all in that link to belong to the same neighborhood t t high normality low normality gmanish@microsoft.com, jing@buffalo.edu, charu@us.ibm.com, hanj@cs.uiuc.edu
Tutorial Outline • Introduction [10 min] • Static Graph Outlier Detection Algorithms [45 min] • Minimum Description Length [10 min] • Ego-net Metrics [5 min] • Random Walks [5 min] • Random Field Models [10 min] • Outliers in Heterogeneous Networks [15 min] • Break [10 min] • Dynamic Graph Outlier Detection Algorithms [45 min] • Summary [10 min] gmanish@microsoft.com, jing@buffalo.edu, charu@us.ibm.com, hanj@cs.uiuc.edu
Gao et al, KDD’10 Community Outliers • Definition • Two information sources: links, node features • There exist communities based on links and node features • Objects that have feature values deviating from those of other members in the same community are defined as community outliers high-income low-income community outlier gmanish@microsoft.com, jing@buffalo.edu, charu@us.ibm.com, hanj@cs.uiuc.edu
Alternative Network Outlier Definitions • Global outlier: only consider node features • Structural outlier: only consider links • Local outlier: only consider the feature values of direct neighbors local outlier structural outlier gmanish@microsoft.com, jing@buffalo.edu, charu@us.ibm.com, hanj@cs.uiuc.edu
A Unified Probabilistic Model (1) community label Z {0,1,2,… K} outlier node features X link structure W model parameters high-income: mean: 116k std: 35k low-income: mean: 20k std: 12k K: number of communities gmanish@microsoft.com, jing@buffalo.edu, charu@us.ibm.com, hanj@cs.uiuc.edu
A Unified Probabilistic Model (2) • Maximize • depends on the community label and model parameters • E.g., salaries in the high or low-income communities follow Gaussian distributions defined by mean and std • is higher if neighboring nodes from normal communities share the same community label • E.g., two linked persons are more likely to be in the same community • Outliers are isolated— for outliers does not depend on the labels of neighbors gmanish@microsoft.com, jing@buffalo.edu, charu@us.ibm.com, hanj@cs.uiuc.edu
Community Outlier Detection Algorithm • : model parameters • Z: community labels Initialize • Continuous Data • Gaussian distribution • Model parameters: mean, standard deviation • Text Data • Multinomial distribution • Model parameters: probability of a word appearing in a community Fix , find that maximizes Parameter estimation Fix , find that maximizes Inference gmanish@microsoft.com, jing@buffalo.edu, charu@us.ibm.com, hanj@cs.uiuc.edu
Comparing Community Outliers with Alternative Outlier Definitions • Baseline models • GLODA: global outlier detection (based on node features only) • DNODA: local outlier detection (check the feature values of direct neighbors) • CNA: partition data into communities based on links and then conduct outlier detection in each community gmanish@microsoft.com, jing@buffalo.edu, charu@us.ibm.com, hanj@cs.uiuc.edu
Community Outliers in DBLP • Conferences graph • Links: % common authors among two conferences • Node features: publication titles in the conference • Communities • Database: ICDE, VLDB, SIGMOD, PODS, EDBT • Artificial Intelligence: IJCAI, AAAI, ICML, ECML • Data Mining: KDD, PAKDD, ICDM, PKDD, SDM • Information Retrieval: SIGIR, WWW, ECIR, WSDM • Community Outliers • CVPR and CIKM gmanish@microsoft.com, jing@buffalo.edu, charu@us.ibm.com, hanj@cs.uiuc.edu
Qi et al, WSDM’12 Community Outlier Links on Heterogeneous Networks • Both content and link structure are important when performing clustering of objects in a network • Heterogeneous random fields model is proposed to model the structure and content together • Noisy links (spam, errors, or incidental links) are detected and their impact on the clustering algorithm can be significantly reduced gmanish@microsoft.com, jing@buffalo.edu, charu@us.ibm.com, hanj@cs.uiuc.edu
Heterogeneous Random Field Model Notations • Tri-partite graph: • is set of users • is set of social media objects • is set of tags • denote the community label (from ) of the user, object and tag respectively • indicates whether the link is noisy • indicates whether the link is noisy • denotes the confidence level of the links gmanish@microsoft.com, jing@buffalo.edu, charu@us.ibm.com, hanj@cs.uiuc.edu
Heterogeneous Random Field Model • Energy functions along the edges • Generative model of feature vectors X for all social media objects in the network • Random field on heterogeneous tri-partite graph G • Inference using Gibbs Sampling gmanish@microsoft.com, jing@buffalo.edu, charu@us.ibm.com, hanj@cs.uiuc.edu
Tutorial Outline • Introduction [10 min] • Static Graph Outlier Detection Algorithms [45 min] • Minimum Description Length [10 min] • Ego-net Metrics [5 min] • Random Walks [5 min] • Random Field Models [10 min] • Outliers in Heterogeneous Networks [15 min] • Break [10 min] • Dynamic Graph Outlier Detection Algorithms [45 min] • Summary [10 min] gmanish@microsoft.com, jing@buffalo.edu, charu@us.ibm.com, hanj@cs.uiuc.edu