Foundations for Offshore Wind Towers
270 likes | 444 Vues
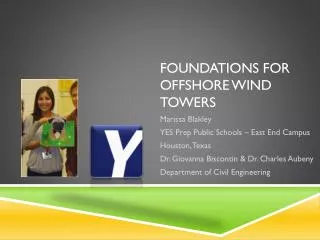
Foundations for Offshore Wind Towers. Marissa Blakley YES Prep Public Schools – Houston, Texas Dr. Giovanna Biscontin & Dr. Charles Aubeny Department of Civil Engineering. The Research Problem.

Foundations for Offshore Wind Towers
E N D
Presentation Transcript
Foundations for Offshore Wind Towers Marissa Blakley YES Prep Public Schools – Houston, Texas Dr. Giovanna Biscontin & Dr. Charles Aubeny Department of Civil Engineering
The Research Problem • The strong lateral forces present at sea cause wind turbines to vibrate, or rock back and forth. • These vibrations cause the soil at the bottom of the ocean to weaken, creating a vertical angle between the pile and ocean floor. • If this angle exceeds 5o, the wind turbine stops producing energy. Texas A&M University, Department of Civil Engineering
My Research Experience • In order to measure the strength of the soil, the research team conducted T-bar and Mini Shear Vane tests using soil mined and shipped from Florida. • Teachers were responsible for mixing powdered clay and water to a predetermined water content of 55%, and determining the soil strength by running each of the tests. • Data was collected using the T-bar, Mini Shear Vane, Basic DAQ and Smart Motor Interface computer software. • The T-bar test recorded voltages and then multiplied by the calibration factor giving force, which is an indicator of soil strength. • The Mini Shear Vane test recorded voltages and multiplied by the calibration factor giving torque. • With these different methods of collecting data, we were able to improve our understanding of the soil mechanics in the ocean.
Unit 5- Sinusoidal Functions • Enduring Understandings • Using the Unit Circle and right triangle trigonometry, we can generate the graphs for the sinusoidal functions y = sin(x) and y = cos(x). • Sinusoidal functions can be used to model real world applications – the rise and fall of tides, pendulum motion, the movement of weights supported by springs, etc. • All previous transformations of functions can be applied to sinusoidal functions. • Essential Questions • How does understanding the unit circle, lead to the construction of the graphs of and ? • What types of real-world problems can be modeled and solved using trigonometry? • How are graphic representations of the trigonometric functions useful in understanding real-life phenomena?
Key Words • Amplitude • Period • Midline • Periodic Function • Periodic Phenomena • Sinusoidal Function • Sinusoidal Regression • Geotechnical Engineering • Wind Turbine • Monopile • Blades • Low-g Accelerometer • Energy Diversification
ENGAGE. Day 1 - Quickwrite What is engineering to you? Based on your prior experiences, what do you think an engineer does?
ENGAGE. Day 1 – Class Discussion What are the different kinds of engineering? • Aerospace • Agricultural • Biological • Biomedical • Chemical • Civil • Computer Science • Electrical • Engineering Technology • Industrial Distribution • Industrial & Systems • Mechanical • Nuclear • Petroleum
EXPLORE. Day 1- Engineering Video
EXPLORE. Day 1- Types of Civil Engineering • Coastal • Ocean • Construction • Environmental • Geotechnical • Materials • Structural • Transportation • Water Resources http://en.wikipedia.org/wiki/Geotechnical_engineering
EXPLAIN. Day 1- My Research
EXPLAIN. Day 1- The Wind Turbine Project • The Task • In teams of four, design an offshore wind turbine with budget and specification guidelines that will perform under sea-like conditions.
EXPLAIN. Day 1- The Wind Turbine Project • The Model • Create a subsurface structure that will attach to a wind tower no larger than 18 vertical inches with attached blades.
EXPLAIN. Day 1- The Wind Turbine Project • The Budget • All models must be completed using the provided materials, and each group must remain at or under their project budget–60 Eddy bucks.
EXPLAIN. Day 1- The Wind Turbine Project • The Materials • Sheets of plastic • Wooden dowels • Popsicle sticks • Toothpicks • Pipe Cleaners • Glue Stick • Straws • Sheets of cardstock • Rubber bands • Pushpins • Large paper clips • Small paper clips • Brads • Sheets of foam • Paint sticks • Duct tape • Scissors $6/sheet $2 each $3 each $1 each $2 each $0.50 each $0.10 each $4 each $2 each $2/sq. in. $5 each $3each $1 each $0.50/6 inch piece $1 each $2 each $2/sheet
ELABORATE. Day 2- The Engineering Design Process Mr. Tim Chinn, Texas A&M University
ELABORATE. Day 2- The Wind Turbine Project • The Tracker
ELABORATE. Day 2- The Wind Turbine Project • The Tests • Each team’s model will be tested in two ways: • How much does the structure vibrate when put under wind conditions? • How much weight can be applied before each structure fails? Vernier.com
ELABORATE. Day 2- Improving Designs • The majority of Day 2 will be spent in the design phase of the engineering design process. • Each team will be provided with a bucket full of the soil mixture (75% water content) to test their creations. • As they work on their models, teams will be allowed to simulate testing conditions & improve their designs.
EVALUATE. Day 3- Testing & Data Collection Test 1: How much does the structure vibrate when put under wind-like conditions? Test 2: How much weight can be applied before each structure fails?
EVALUATE. Day 3- The Rubric
EVALUATE. Day 4- PreCalculus Connections
Sample Pre-Test & Post-Test Questions • Over the course of one day, a team of scientists has recorded the ground temperature, measured in oF, as a function of the time t, measured in hours since midnight. The scientists have agreed that this data is periodic and can be properly modeled using a sinusoidal function. Based on this model, which of the following statements is true? I. The maximum temperature in the desert occurs before 2:00 p.m. II. Between midnight and 6:00 a.m., the temperature remains below 76oF III. The temperature in the desert is decreasing between 3:00 a.m. and 4:00 a.m. A. I only D. II and III only. B. II only E. I, II and III C. I and III only
Special Thanks • Dr. Giovanna Biscontin • Dr. Charles Aubeny • Ryan Beemer • MadahuriMurali • Francisco Grajales • Michelle Bernhardt • Silvia Vital • E3 Team