Download
1 / 20
210 likes | 405 Vues
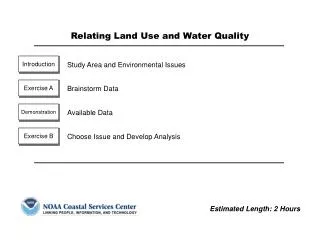
Introduction. Study Area and Environmental Issues. Exercise A. Exercise B. Demonstration. Brainstorm Data. Choose Issue and Develop Analysis. Available Data. Relating Land Use and Water Quality. Estimated Length: 2 Hours.

E N D
Introduction Study Area and Environmental Issues Exercise A Exercise B Demonstration Brainstorm Data Choose Issue and Develop Analysis Available Data Relating Land Use and Water Quality Estimated Length: 2 Hours
This module helps bring together everything that has been learned in the previous modules and exercises. You will be asked to use the skills and knowledge you gained in this course to solve a typical geographic information system (GIS) problem. By working through this process in a group setting, you will be able to draw from many different points of view, which will be very beneficial in the development stages. Development of data flow diagrams for GIS analyses Relating Land Use and Water Quality Module Introduction Overview • ArcView Components • ArcMap • ArcCatalog • ArcToolbox • ArcView Extensions • TBD • Geoprocessing Tools • TBD Tools and Technology Skills Learned
Relating Land Use and Water Quality Introduction: Study Area • Biscayne Bay, Florida • Biscayne Bay is the largest estuary on the coast of southeast Florida • It is contiguous with the Southern Florida Everglades and Florida Bay • Biscayne Bay encompasses a marine ecosystem that totals approximately 428 square miles • Drainage area is 938 square miles, of which 350 are freshwater and coastal wetlands Boca Chita Key in Biscayne Bay
Relating Land Use and Water Quality Introduction: Study Area • Biscayne Bay, Florida • Biscayne Bay is part of a large south Florida ecosystem • It relies upon water that flows directly from the Everglades, through the Biscayne Bay watershed, and into the bay • Biscayne Bay is home to • Biscayne National Park, the largest marine park in the national park system • Oleta River State Park • Bill Baggs Cape Florida State Park • Biscayne Bay Aquatic Preserve • Barnacle State Historic Site • Numerous local parks
Relating Land Use and Water Quality Introduction: Study Area • Biscayne Bay, Florida • Biscayne Bay is also home to one of the largest commercial and passenger ports of call in the world, the Port of Miami • The Miami River, one of the largest tributaries of the bay, is the primary service area of international trade to the Caribbean • Biscayne Bay plays an integral part in the growth of the entire Caribbean region
Relating Land Use and Water Quality Introduction: Environmental Issues • Overview • There are several environmental concerns in Biscayne Bay: • The channelization of this part of the state has lowered the freshwater table as much as four feet • Freshwater flow into the bay has changed from sheet flows into intense point source flows, altering the salinity of different parts of the bay • Development, especially in the northern part of the bay, has dramatically altered the natural flora and fauna
Relating Land Use and Water Quality Introduction: Environmental Issues • Overview • Additional Environmental Concerns: • Human use of the bay poses ongoing concerns like potential damage to coral reefs, destruction of seagrass beds, etc. • Population growth threatens the mangrove forests that grow in desirable coastal areas • Restoration projects like the Comprehensive Everglades Restoration Plan (CERP) might cause unforeseen problems
Background As part of the newly formed Biscayne Bay Project Coordination Team, your job is to determine what kinds of analyses are possible, given the technology you have access to, and what type of data you will need. Fortunately, your organization has been granted ESRI’s ArcGIS software for use in your conservation efforts. Your group needs to discuss the possible analyses that could be performed with GIS. The group also needs to think of possible data sets that might be useful. From these discussions, the group should develop a list of data that will be required to perform the tasks, as well as a “wish list” of data that you would like to have. Objectives Discuss the possible analysis that could be performed looking at water quality and its link to land use Discuss data that would be useful in completing these analysis tasks Review available data and compare with your data wish list Relating Land Use and Water Quality Exercise A: Brainstorm Data Goal After hearing the lecture and working through the exercises, the student will be able to address the issues surrounding data collection and application.
Group Discussion: What type of questions could the GIS help you answer about the relationship between water quality and land use around Biscayne Bay? Discuss and record data that would be necessary to complete the different GIS analyses discussed in your groups. Prioritize the data in your wish list. Relating Land Use and Water Quality Exercise A: Brainstorm Data • ______________________________________________________________________________________________________________________________________________________________________________________________________________________________________________________________________________________________________________________________________________________________________________________________________________________________________________________________________________________________________________________________________________________________________________________________ • __________________________________________________________________________________
Your instructor will show some of the data sets that are available for use in your analyses. Do they differ from the data sets you came up with in your groups? If so, how? ___________________________________________________________________ ___________________________________________________________________ ___________________________________________________________________ ___________________________________________________________________ ___________________________________________________________________ ___________________________________________________________________ ___________________________________________________________________ ___________________________________________________________________ ___________________________________________________________________ ___________________________________________________________________ ___________________________________________________________________ Relating Land Use and Water Quality Demonstration: Available Data
Relating Land Use and Water Quality Exercise A: Brainstorm Data • In this exercise, you were introduced to some of the history surrounding Biscayne Bay, Florida, in order to gain a better understanding of what it might be like to work for this community. In this module, you and your group discussed possible analyses you would want to perform with the GIS. With that in mind, you needed to think of possible data sets that would be required for these analyses. Once you developed your “wish list,” you were then able to compare it to actual available data for your area. Exercise Summary
Relating Land Use and Water Quality Discussion: Biscayne Bay Environmental Issues • Seagrass Degradation • The natural seagrass beds of Biscayne Bay have suffered from several different types of stresses, including dredge and fill activities, urban development, navigation and change in salinity patterns due to channelization of the natural water flow • Water Pollution • The geography of Biscayne Bay makes it a prime target for hurricanes and other major storms • The possibility of several toxic releases into the bay in the event of flooding poses serious concerns
Relating Land Use and Water Quality Exercise B: Choose Issue and Develop Analysis • Background • After reviewing the available data, the coordination • team has asked your group to pick one of the identified • issues to focus on. Once you have chosen an issue, • your group will need to retrieve any pertinent data and • examine them in detail to make sure they will work inside the GIS software. • Your group will then need to create a flow diagram that • outlines the steps you will take to address the issue • facing you. • After you have created a flowchart, you will implement • your design by using the knowledge and skills gained • throughout this course. Goal After hearing the lecture and working through the exercises, the students will be able to discuss the limitations of the available data and how they plan on completing the task with GIS. They will also be able to implement a flowchart and solve a problem using the tools found in ArcGIS. • Objectives • Review available data and determine what manipulation might be needed to use them • Create a flowchart outlining the steps to take to complete the needed analysis • Solve a GIS problem using the skills, knowledge, and aptitude gained during this course
Relating Land Use and Water Quality Exercise B: Choose Issue and Develop Analysis • In small groups: • Choose an issue and review the appropriate data. You may choose to address one of the following issues: • Seagrass – The natural seagrass beds of Biscayne Bay have suffered from several different types of stresses including dredge and fill activities, urban development, navigation, and change in salinity patterns due to channelization of the natural water flow. Use the available data to determine which seagrass beds are in danger of scarring from ships with drafts of six feet or more transiting marked navigation channels. Then create a layer that you will propose as a navigational Area To Be Avoided (ATBA). After you have completed your analysis, create a map that will convey your point to the coordination team. • Pollution – The geography of Biscayne Bay makes it a prime target for hurricanes and other major storms. The possibility of several toxic releases into the bay in the event of flooding poses serious concerns. Use the available data to locate possible sites that might distribute toxic substances into the environment in the event of a 100-year flooding event. Generate a report listing the potential polluters and create a map indicating where these pollutants would enter the bay.
Relating Land Use and Water Quality Exercise B: Choose Issue and Develop Analysis • Process Steps: • Review problem, goals, and criteria • Choose data sets that will be needed to perform analysis (located in the LandUse_WaterQuality directory) • Determine processes (geoprocessing operations) that will need to be performed on the data in order to reach goal • Create a flowchart to map out analysis • Implement analysis in ArcGIS
Relating Land Use and Water Quality Exercise B: Choose Issue and Examine Data • Flowchart – use this area to diagram your flowchart
Relating Land Use and Water Quality Discussion: Implementation Success • How well did the implementation of your flowchart go? • How were you affected by data limitations? • What other issues did you run in to? • ___________________________________________________________________ • ___________________________________________________________________ • ___________________________________________________________________ • ___________________________________________________________________ • ___________________________________________________________________ • ___________________________________________________________________ • ___________________________________________________________________ • ___________________________________________________________________ • ___________________________________________________________________ • ___________________________________________________________________ • ___________________________________________________________________ • ___________________________________________________________________
Relating Land Use and Water Quality Module Conclusion Module Summary Exercise Summary In this exercise, you were able to review the existing data sets for the project site and compare them to your own “wish list.” After reviewing any data limitations, you were then asked to determine what changes to the data might be required to complete the needed analysis. You were asked to construct a data flow diagram outlining the process steps needed to complete the analysis. You implemented the process steps of the previously developed flowchart in an effort to solve your specific GIS problem. By using all the information and skills you learned in this class, you were able to address the issue in an organized and efficient way. • In a sense, this module represents the culmination of this training class. Now that you have a better understanding of the processes surrounding a GIS analysis, you are better prepared to address any GIS problem in a systematic way.