Analysis of UK Government Spending: Appropriation Acts of 1996 and 2002
This analysis by Louise Dore examines UK government spending outlined in the Appropriation Acts for the financial years 1996-97 and 2002-03. It highlights trends in the expenditure of various government departments, noting significant increases in health and social security while showing a surprising decrease in transport funding. Adjustments for inflation and economic growth reveal that, despite expectations of increased spending under Labour, total government expenditure as a percentage of GDP actually declined from 31.18% in 1996 to 30.49% in 2002.

Analysis of UK Government Spending: Appropriation Acts of 1996 and 2002
E N D
Presentation Transcript
Appropriation Acts An analysis of UK government spending in 1996 and 2002 by Louise Dore
Appropriation Act 1996 Published 24 July 1996 Covers government spending for the financial year 1996-97 Final Appropriation Act of Major’s Conservative government Chancellor of the Exchequer was Kenneth Clarke Appropriation Act 2002 Published 8 July 2002 Covers government spending for the financial year 2002-03 Latest Appropriation Act of Blair’s Labour government Chancellor of the Exchequer is Gordon Brown Source Material Louise Dore May 2003
Classes • Spending is listed within categories or ‘classes’ which are roughly equivalent to the various government departments • I have had to merge some of these due to department changes between 1996 and 2002 • For example: classes V and VI are merged because the old Departments of Transport and the Environment became one new Department for Transport, Local Government and the Regions under Labour Louise Dore May 2003
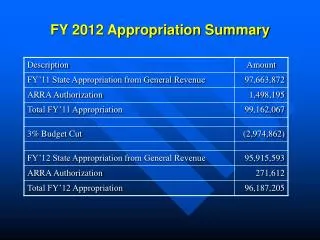
First: the figures 1996 2002 Class I: Ministry of Defence £25,147,319,000 £36,725,624,000 Class II: Foreign Office £3,017,714,000 £4,367,391,000 Class III: Farming and Rural Affairs £5,106,121,000 £4,785,909,000 Class IV: Dept Trade and Industry £4,436,355,000 £5,877,511,000 Classes V and VI: Transport and Regions £45,967,980,000 £57,176,707,000 Class VII: Home Office £6,556,672,000 £10,850,262,000 Class VIII: Lord Chancellor's Dept £3,003,041,000 £3,759,648,000 Class X: Heritage/Culture, Media and Sport £2,920,755,000 £3,495,582,000 Class XI: Education £18,835,204,000 £26,723,134,000 Class XI: Health £39,244,874,000 £61,674,572,000 Class XII:Social Security/Work and Pensions £50,493,359,000 £58,257,626,000 Class XIII: Scotland Office £14,491,880,000 £16,564,307,000 Class XIV: Wales Office £6,499,390,000 £8,671,992,000 Class XV: NI Office £3,271,428,000 £9,275,065,000 Class XVI: Treasury and Inland Revenue, etc. £4,151,662,000 £4,879,178,000 Class XVII: Cabinet Office £3,345,885,000 £3,420,462,000 Class XVIII: Parliamentary Offices £1,136,610,000 £1,550,999,000 Total: £237,626,249,000 £318,055,969,000 Louise Dore May 2003
Spending in 1996 Louise Dore May 2003
Spending in 2002 Louise Dore May 2003
Spending • As you can see from the pie charts, spending in terms of absolute percentage has remained roughly the same • The largest areas of spending are: • Dept of Work and Pensions - formerly the DSS • Health • Transport and the regions • The level of spending on transport and the regions is surprising to most, considering how little improvement appears to be made Louise Dore May 2003
Adjusting the figures • These figures do not have much relevance unless adjusted for inflation and the growth of the economy in the intervening period • The Office of National Statistics gives Gross Domestic Product (GDP) at current prices (i.e. adjusted for inflation) • There was a 37% increase between 1996 and 2002 Louise Dore May 2003
Spending in terms of GDP Louise Dore May 2003
Spending in terms of GDP • As this graph shows: • few areas of government spending have increased substantially • none have increased by a third, in line with the growth in the economy • some have decreased • Overall government spending has decreased from 31.18% of GDP in 1996 to 30.49% in 2002 • Surprised? Those who expected “tax-and-spend” Labour might be! Louise Dore May 2003
Case studies • Education, education, education? • The Department of Education has received a minuscule 3.6% real-terms increase on its 1996 funding • An injection of cash • Health spending went up by more than 15% • Going off the rails • Funds for transport and the regions have fallen by 9.1% • Keeping the peace • The Northern Ireland office was the big winner, with a 107% boost to fund the Stormont Assembly Louise Dore May 2003
So what does this mean? • It means the figures back up Gordon Brown’s famous infatuation with Prudence! • Despite a booming economy and pressure from within his party, he has restricted public spending • In this way he has managed to wipe £3 billion off the national debt] • However, in the 20th century the trend has been for government spending to increase as proportion of GDP - will the 21st century really see a change? Louise Dore May 2003
All published legislation is available through Her Majesty’s Stationary Office at: http://www.legislation.hmso.gov.uk/acts.htm Publications of the National Office of Statistics are available at:http://www.statistics.gov.uk Web-ography Louise Dore May 2003