Download
1 / 54
650 likes | 1.84k Vues
FINC4101 Investment Analysis. Instructor: Dr. Leng Ling Topic: Portfolio Theory II. Learning objectives. Explain the benefit of diversification and identify the source of this benefit. Understand the concepts of covariance and correlation.

E N D
FINC4101 Investment Analysis Instructor: Dr. Leng Ling Topic: Portfolio Theory II
Learning objectives • Explain the benefit of diversification and identify the source of this benefit. • Understand the concepts of covariance and correlation. • Compute covariance and correlation between two risky assets. • Compute the expected return and standard deviation of a portfolio of two risky assets. • Define the minimum variance portfolio and compute its weights in the 2-risky asset case. • Define the investment opportunity set and the efficient frontier.
Learning objectives • Compute the expected return and standard deviation of a portfolio consisting of a risky asset/portfolio and a risk-free asset. • Define the Capital Allocation Line. • Define and compute the reward-to-variability (Sharpe) ratio. • Define the tangency portfolio and compute its weights in a 2-risky asset case. • Describe the process of efficient diversification with many risky asset and a risk-free asset. • Understand the idea of the separation property.
Why diversify? To reduce risk. This is the basic benefit of diversification.
How does diversification work? • By exploiting the way different assets relate to each other. • We use a statistical measure called covarianceto characterize the tendency of two assets to “move” with each other. • Covariance: A measure of the extent to which the returns of two assets tend to vary with each other. • An equivalent and easier to interpret measure is the correlation coefficient.
Simple example • Consider two assets: a stock and a bond. There are 3 possible scenarios over the coming year:
Portfolio of 60% in stock & 40% in bond • What is the expected return and S.D. of this portfolio?
Diversification lowers risk! • Compare the standard deviations of the stock, bond and portfolio: • The portfolio is actually less risky than either of the two assets. Diversification lowers investment risk. • Why? Stock and bond returns tend to move in opposition to each other. • How do we measure this tendency? -- Covariance
Covariance formula • Suppose there are S possible scenarios (i = 1,2,…,S), and the probability of scenario i is p(i), then covariance between assets A and B is Asset A’s return in scenario i Asset B’s return in scenario i
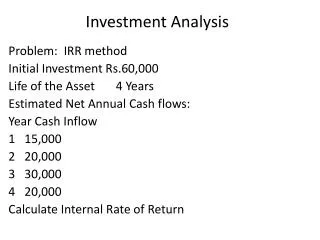
Apply covariance formula • Go back to the example, but now suppose the returns on the stock are -14%, 13% and +30%. Compute the stock’s expected return, variance, and covariance with bond.
Correlation between assets A & B, rAB , is • Given this formula, we can write covariance as Going back to our example, the correlation between stock and bond = -114/(14.92 x 7.75) = -0.99
Interpreting the correlation coefficient • Correlations range from -1 to 1.
Three rules of two-risky asset portfolio Suppose you have a portfolio consisting of two risky assets, A and B. You invest the proportion, wA, of the portfolio in A and the proportion, wB, in B. You know the following: • The return on asset A is rA; the return on asset B is rB. • The expected return on asset A is E(rA) ; the expected return on asset B is E(rB). • The standard deviation of A is sA; the standard deviation of B is sB. • The correlation coefficient between the returns of A and B is rAB.
Rule 1: Portfolio rate of return • A portfolio’s rate of return (rP) is a weighted average of the returns on the component assets, with the investment proportions as weights, rP = wArA + wBrB
Rule 2: Portfolio expected return • A portfolio’s expected return is a weighted average of the expected returns on the component assets with the same portfolio proportions as weights, E(rP) = wA E(rA) + wB E(rB)
Rule 3: Portfolio variance • A portfolio’s variance (sP2) is sP2 = (wAsA)2 + (wBsB)2 + 2(wAsA) (wBsB)rAB • Since cov(rA,rB) = sAsBrAB , we can also write portfolio variance as sP2 = (wAsA)2 + (wBsB)2 + 2wAwBcov(rA,rB) • Taking the square root of sP2 gives us the portfolio standard deviation.
Applying these rules • Suppose you have two assets (A,B) with the following details: E(rA)=6%, E(rB)=10%, sA=12%, sB=25%, rAB=0 wA= 0.5 • Verify that: • portfolio expected return is 8% • portfolio SD is 13.87%
Discussion • By investing in two assets, the portfolio volatility is smaller than the average of volatilities of the two assets. • Why not use SD=(12+25)/2=18.5%?
Minimum variance portfolio • Weight on asset A is: • Weight on asset B is = 1 – wA. • Using this formula, verify that the min variance portfolio has wA=81.27%, wB=18.73%.
Investment opportunity set • The set of all attainable combinations of risk and return offered by portfolios formed using the available assets in differing proportions. B Z A
Mean variance criterion & the efficient frontier • Mean-variance criterion: choosing assets/portfolios based on the expected return and variance (or SD) of portfolios. • Using this criterion, we prefer portfolio A to portfolio B (or A dominates B) if: E(rA) E(rB) and sA sB • Efficient frontier: portfolios on the upward sloping portion of the investment opportunity set.
Practice 2 • Chapter 5: CFA problems: 4,7,8,9,11. • Chapter 6: CFA problems: 1, 3(a) only.
Homework 2 1. If required risk premium= , where A=4, and risk free rate = 1%, what are the annual required rates of return for the following investments? What will be the value of these investments after 2 years, if these investments have achieved the required return rates? 2. You are considering investing in 2 assets. A asset has an expected return of 15% and standard deviation of 32%. B asset has an expected return of 9% and standard deviation of 23%. The correlation between A and B is 0.15. • What is the covariance between A and B? • What is the weight of A and B in the minimum variance portfolio? • What is the expected return and variance of the minimum variance portfolio?
Extreme cases Suppose rAB= 1, sP2 = (wAsA + wBsB)2 sP = wAsA + wBsB • No gains from diversification only in this case! • Whenever r< 1, there are gains from diversification. • Suppose rAB= -1, sP2 = (wAsA - wBsB)2 sP = ABS[ wAsA – wBsB ]
Problem • Jane Marple has an $800,000 fully diversified portfolio. She subsequently inherits Rafael Aerospace Inc. stock worth $200,000. Her financial advisor provided her with the following information for the coming year: • The correlation between the original portfolio and Rafael Aerospace is 0.3. • Jane will keep the new stock. (a) Calculate the expected return and standard deviation of the new portfolio. (b) Calculate the covariance between the original portfolio and Rafael Aerospace.
Follow-up problems • Jane decides to keep Rafael Aerospace but wants to rebalance the new portfolio so that risk is reduced to the minimum. What are the weights, the expected return and std dev of the minimum variance portfolio? • Continuing with the previous problem, if Jane keeps the original composition, what is the portfolio expected return and SD if the correlation is (a) 1, (b) -1.
Asset allocation involving risky assets and a risk-free asset. • What’s a risk-free asset? • An asset that provides a sure (for certain) nominal rate of return. It is a default free asset. Examples: • U.S. Treasury securities (Treasury bills, Treasury notes, Treasury bonds), • Portfolios invested in these securities, e.g., T-bill money market fund. • In practice, money market instruments like bank certificate of deposits (CDs) and commercial paper are treated as effectively risk-free.
Properties of risk-free asset • There is no uncertainty in return. • Variance of risk-free asset is 0 • Likewise, standard deviation is 0 • The risk-free asset does not vary with a risky asset/ portfolio. So, • Cov(risk-free asset, risky asset) = 0 • Corr(risk-free asset, risky asset) = 0
3 rules when there is one risk-free asset & one risky asset (1) P: risky asset/ portfolio (wP) + Risk-free asset (wf) • What is the correlation between P and the risk-free asset? Complete portfolio, C
3 rules when there is one risk-free asset & one risky asset (2) 1) Portfolio return, rC = wP rP + wf rf 2) Portfolio expected return, E(rC) = wP E(rP) + wf rf Portfolio risk premium, E(rC) - rf = wP [ E(rP) – rf ] 3) Portfolio variance, sC2 = (wPsP)2 Portfolio standard deviation, sC = wPsP
Capital Allocation Line (CAL) • If we plot the expected return and standard deviation combinations of a complete portfolio, we get the Capital Allocation Line (CAL). • CAL: The plot of risk-return combinations available by varying portfolio allocation between a risk-free asset and a risky asset/portfolio. • CAL is just the investment opportunity set when we have a risk-free asset and a risky asset/portfolio! • Capital Market Line (CML): the CAL when the market index portfolio is used as the risky portfolio.
Apply these rules • Suppose the risky portfolio P has an expected return of 15% and a standard deviation of 22%. The risk-free asset promises a return of 7%. • Compute the expected return, risk premium and standard deviation of the complete portfolio if • 100% of the portfolio is invested in P • 100% of the portfolio is invested in the risk-free asset • Equal weight is placed on P and the risk-free asset. • Draw the CAL.
Capital Allocation Line (CAL) Slope of CAL = increase in expected return per unit of additional standard deviation (SD), i.e., the extra return per extra risk. The slope is also called the Sharpe ratio, reward-to-variability ratio.
Sharpe ratio, S • Sharpe ratio is the slope, so use “rise” over “run”. • For our example, Sharpe ratio= (15 – 7)/(22 – 0) = 8/22 = 0.36 • In general, Sharpe ratio of portfolio S = portfolio risk premium / portfolio std dev • Sharpe ratio is the same for all portfolios that plot on the CAL.
Problems involving risk-free and risky assets • Assume you manage a risky portfolio with an expected rate of return of 17% and a standard deviation of 27%. The T-bill rate is 7%. a) Your client invests 70% of his portfolio in your fund and 30% in a T-bill money market fund. What is the expected return and standard deviation of your client’s portfolio? b) Suppose your risky portfolio includes the following investments in the given proportions: What are the investment proportions of your client’s overall portfolio, including the position in the T-bills? c) What is the Sharpe ratio of your risky portfolio and your client’s overall portfolio? d) Draw the CAL and point the positions of your and your client’s portfolios.
Optimal risky portfolio with a risk-free asset • When we have risky assets and a risk-free asset, we can identify one single risky portfolio that gives us the highest possible Sharpe (reward-to-variability) ratio. • This risky portfolio is the ‘optimal’ or ‘tangency’ portfolio. • The CAL formed using the optimal risky portfolio has the steepest slope.
Go back to the 2 risky assets: A and B but assume correlation is 0.2. Now add a risk-free asset with 5% return B CAL2 CAL1 2 1 A Recall: E(rA)=6%, E(rB)=10%,sA=12%, sB=25%, rAB=0.2.
Optimal risky portfolio weights Using the formulas, the weights in the optimal portfolio (O): wA = 32.99%, wB = 67.01% Expected return, SD, Sharpe ratio: E(rO) = 8.68% sO = 17.97% SharpeO= (8.68 – 5)/17.97 = 0.20
Risk aversion and portfolio choice Preferred complete portfolio: 55% in Portfolio O, 45% in risk-free asset.
Consider the following • A pension fund manager is considering 3 mutual funds. The first is a stock fund, the second is a corporate bond fund, and the third is a T-bill money market fund that yields a sure rate of 5.5%. The expected return and sigma of the risky funds are: • The correlation between the risky fund returns is 0.25.
Answer the following: 1)Compute the expected return and standard deviation of the minimum variance portfolio. 2)Compute the expected return and standard deviation of the tangency portfolio. 3)What is the Sharpe ratio of the tangency portfolio? 4)Suppose you want to form a complete portfolio on the CAL. The portfolio must yield an expected return of 12%. • What is the standard deviation of the portfolio? • What is the proportion invested in the T-bill fund and each of the two risky funds?
Efficient diversification with many risky assets & a risk-free asset (1) Efficient diversification entails 3 separate steps: • Form efficient frontier of risky assets • Efficient frontier: the collection of portfolios that maximizes expected return at each level of portfolio risk/ standard deviation. • Northwestern-most portfolios • Inputs: expected return and SD of every risky asset, plus correlation coefficients between each pair of assets.
Efficient frontier of risky assets Inefficiently diversified. N W E Portfolios are discarded. Dominated by portfolios on efficient frontier. S
Efficient diversification with many risky assets & a risk-free asset (2) • Use the risk-free rate and efficient frontier to find the tangency portfolio or optimal risky portfolio • Recall that the tangency portfolio gives us the CAL with the highest Sharpe ratio • Investor chooses the preferred complete portfolio based on his/her risk aversion. • Each investors will use tangency portfolio in forming his/her complete portfolio