Spatial and Temporal Scale and Climate Change
210 likes | 571 Vues
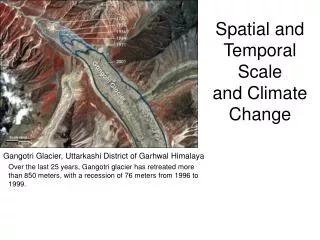
Spatial and Temporal Scale and Climate Change. Gangotri Glacier, Uttarkashi District of Garhwal Himalaya. Over the last 25 years, Gangotri glacier has retreated more than 850 meters, with a recession of 76 meters from 1996 to 1999. Climate Variability in Time and Space.

Spatial and Temporal Scale and Climate Change
E N D
Presentation Transcript
Spatial and Temporal Scale and Climate Change Gangotri Glacier, Uttarkashi District of Garhwal Himalaya Over the last 25 years, Gangotri glacier has retreated more than 850 meters, with a recession of 76 meters from 1996 to 1999.
Climate Variability in Time and Space • Scale is everything. Some litmus tests: • Record extent (spatial) Length of record (temporal) • Grain (spatial) Resolution of time steps (temporal) • Ubiquity (spatial) vs. coherence (temporal) • Heterogeneity (spatial) vs. nonstationary (temporal) • Process/mechanism scale vs. sampling vs. conclusions
The tradeoff between record length and resolution • Data from paleomagnetism, magnetic anomalies, paleobiogeography, and paleoclimatological evidence http://www.scotese.com/climate.htm
Ice-core proxy records:Full length with evident multi millennial and millennial variability in the Vostok core
Younger Dryas multi-millenial “event” End of the YD is very fast Higher resolution in the GISP2 record from Greenland.
More GISP2 • Inter-annual resolution possible • Strength of record is in groups of decades or centuries. Letters and pink bars are cold periods. From O'Brien, et al., 1995, Science, 270, 1962-1964
More GISP • Significant variability in the last 1200 yr. • Sea-ice extent increase in 13th and 19th century and MWP more or less well resolved
Last 250 yr in ice • Sulfate and nitrate concentration increases evident • Data smoothed to annual resolution after 6 or so sub-annual samples • Laki, Tambora, and Katmai eruptions noted form sulfate signals.
Annual resolution Quelccaya Ice Cap, Peru Tree-ring reconstruction of precipitation in northern New Mexico (HG Grissino-Mayer)
Abrupt climate change • Mechanistic definition • Transition of the climate system into a different state (of temperature, rainfall, and other aspects) on a time scale that is faster than the responsible forcing • Impacts-based definition • Change of the climate system that is faster than the adaptation time of social and/or ecosystems • FEEDBACKS: albedo, precipitation, CO2 (?) Figure 1. As the Earth climate emerged from the most recent ice age, the warming that began 15,000 years ago was interrupted by a cold period known as the Younger Dryas, which in turn ended with abrupt warming. Source: Cuffey and Clow (1997) and Alley (2000).
Different proxies have different spatial and temporal characteristics • Handful of ice cores from different continents; substantial differences in dating even on cores in close proximity: Long records, moderate agreement on long time scales, spatially extensive but poor coverage • Handful of tree cores from the same site, absolutely zero difference in dating Long records, excellent cross-dating on annual and centennial time scales, can build to networks for spatial extent
delta 18O data series extracted from a Tarawa coral core. This record is plotted against instrumental sea surface temperature (SST) and rainfall records and measurements of the Southern Oscillation Index (SOI) in order to observe how well these corals have recorded recent climate variability, including ENSO events. Figure courtesy of Dr. Julie Cole, University of Colorado.
Annual Resolution with verification (cross-dating) Tree-rings Shrub rings corals Quasi annual resolution Ice cores Speleothems (stalagmites) Varved sediments Proxies and Climate Variability