Model Simulation Uniform Recharge – 60 cm/yr
460 likes | 601 Vues
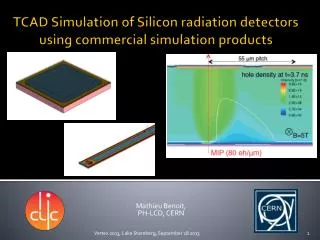
Model Simulation Uniform Recharge – 60 cm/yr. 10 x. http://www.ldeo.columbia.edu/~martins/plumeflow/ppt/ppt2_1_00/sld023.htm. Groundwater contamination plumes associated with source areas at Massachusetts Military Reservation. Rolbein, 1995. Rolbein, 1995. Rolbein, 1995.

Model Simulation Uniform Recharge – 60 cm/yr
E N D
Presentation Transcript
Model Simulation Uniform Recharge – 60 cm/yr 10 x
http://www.ldeo.columbia.edu/~martins/plumeflow/ppt/ppt2_1_00/sld023.htmhttp://www.ldeo.columbia.edu/~martins/plumeflow/ppt/ppt2_1_00/sld023.htm
Groundwater contamination plumes associated with source areas at Massachusetts Military Reservation Rolbein, 1995
Other Conservative Groundwater tracers à tracer moves at the same rate as the water à not impeded by methods such as chemical reactions or degradation. Influenced only by physical processes such as mixing, diffusion, etc. * See page from book: John Cherry, Camp Borden, Ontario. Plume resulting from the continuous injection of a tracer into a two-dimensional flow field. Figure 2.11. Fetter, Contaminant Hydrogeology 3rd Edition
Injection of a slug tracer into a two-dimensional flow field shown at 3 time increments. Figure 2.12. Fetter, Contaminant Hydrogeology 3rd Edition
Behaviors of contaminants I. Movement: - the release (plume) will not spread at a constant rate because there are different paths that it could take- it moves with the water- will take short or long paths around grains.
A. Dispersion: spreading of plumes *water flowing through a porous medium takes different routes *important components: longitudinal & transverse dispersion velocity dependent, so equivalent only for very slow flow http://www.theshop.net/xibits/litigation/diagrams9.htm • D* = 10-5 m2/day. (D* = diffusion constant) • aL = .1m/day (dispersion constant, longitudinal). • ar = .001m/day (dispersion constant, transverse). • ( aL)(Vx) + D* = DL ---> longitudinal • ( aT)(Vz) + D* = DT ---> transverse
Factors causing pore-scale longitudinal dispersion Figure 10.8 Fetter, Applied Hydrogeology 4th Edition
Advective transport and the influence of dispersion and diffusion on “breakthrough” of a solute B. Advection: horizontal velocity Figure 10.10 Fetter, Applied Hydrogeology 4th Edition
Transport and spreading of a solute slug with time due to advection and dispersion. A slug of solute was injected at x = 0 + α at time t0 with a resulting concentration of C0. The ground-water flow is to the right. Figure 2.6. Fetter, Contaminant Hydrogeology 3rd Edition
C. Diffusion: function of concentration & diffusion coefficient Spreading of a solute slug with time due to diffusion. A slug of solute was injected into the aquifer at time t0 with a resulting initial concentration of C0. Figure 2.1. Fetter, Contaminant Hydrogeology 3rd Edition
http://www.ldeo.columbia.edu/~martins/plumeflow/ppt/ppt2_1_00/sld010.htmhttp://www.ldeo.columbia.edu/~martins/plumeflow/ppt/ppt2_1_00/sld010.htm
D. Retardation: • KD = concentration absorbed/ concentration dissolved in water = ml/g • metals attach onto clays. • contaminants attach onto organic carbons. • the higher the KD, the slower things will move in water. • Vx = V(H2O)/ [1 + KD ( r/h)] Influence of retardation on movement of a solute front in a one-dimensional column Figure 10.14 Fetter, Applied Hydrogeology 4th Edition
Lead adsorption by Cecil clay loam at pH 4.5 and at 25oC described by a linear Freundlich equation through the origin. Figure 10.13 Fetter, Applied Hydrogeology 4th Edition log C(ads)= j*logC(diss) +log Kf C(ads) = Kf* Cj
Vx = VH2O/ [1 + KD ( r/h)] Solubility of organics in H2O • KD is proportional to Koc ( octonal and water). KD =KOC * %C • KD is proportional to the organic carbon content -- the higher the KD, the more things attach onto organic carbon, and it moves slower. Vertical migration, in feet per 100 y, of various synthetic organic compounds through a soil with hydraulic conductivity of 1.6 x 10⁻⁸ cm/s, hydraulic gradient of 0.222, bulk density of 2.00 g/cm3, particle density of 2.65, effective porosity of 0.22, and soil organic carbon content of 0.5%. Figure 10.16. Fetter, Applied Hydrogeology 4th Edition
Solubilities and Octanol-Water Partition Coefficients for Some Common Organic Pollutants Table 6-5. Drever The Geochemistry of Natural Waters 3rd Edition
II. Two ways organics migrate • Dissolved: solubility is proportional to mobility (high solubility, then high mobility). 2) NAPL: non-aqueous phase liquid
III. Two types of contaminants (Very broad classes) • DNAPL (Dense Non-Aqueous Phase Liquid) * TCE (density = 1.46) KOC = 150 Solubility in water: 1100ppm * TCA (density = 1.33) 1180ppm * PERC (percholoethylene, density = 1.6) * Methylene Choride (density = 1.33) Solubility = 13000ppm KOC = 25 These are extremely dense.
B. LNAPL (Light Non-Aqueous Phase Liquid) * Benzene 1800ppm KOC = 100 * Toluene 500ppm KOC = 240 * Vinyl Chloride (density less than water and highly volatile) ***NOTE: solubilities given by weight (1 ppm = mg/L). The drinking water standard for benzene is 5 ppb (parts per BILLION)
C. Characteristics: 1. Densities of NAPL's range from .8x water to 1.6x water 2. Density is a function of the chloride. 3. Higher density contaminants can sink quickly through a water table aquifer. 4. Porous vs Fractured Systems exhibit very different behavior. 5. Pure phase vs. dissolved phase different problems associated with each.
NAPL: non-aqueous phase liquid • A) * L-NAPL’s: less dense than water. • ex. Gasoline - forms a pocket which floats on the water table • soluble material e.g. benzene, toluene, xylene (aromatic –6C ring) dissolves in the water • the gasoline (straight chain- octane C8H18) evaporates. Organic liquids such as gasoline, which are only slightly soluble in water and are less dense than water, tend to float on the water table when a spill occurs.Figure 10.19. Fetter, Applied Hydrogeology 4th Edition
NAPL: non-aqueous phase liquid B) * D-NAPL’s: denser than water. • ex. methylene chloride - when its spilled, it is gone and not seen again. • trichloroethylene – can break down to vinyl chloride.
IV. Example: Spill of trichloroethylene (density = 1.33 g/cc). • not that soluble. What happens: migrates down to bedrock and pools there & slowly dissolves as water flows past. -- OR -- • if there are lenses of clay, it will pool on them. • distributed over a wide area, it is impossible to find it and get it out! • try to pump it out only end up removing a small amount of the dissolved phase. • if spill is 100,000 L at 5 ppm, you have to pump 2 x 10⁹ L of water. • concentration decrease overtime as water in shorter contact with NAPL when pumping stops- water flow slows and the concentration goes up. Organic liquids such as trichloroethylene, which are only slightly soluble in water and are more dense than water, may sink to the bottom of an aquifer when a spill occurs.Figure 10.20. Fetter, Applied Hydrogeology 4th Edition
V. Remediating systems Is there really the possibility of remediating organically contaminated systems or are funds better spent elsewhere? A. Questions: 1. size of the spill in terms of 1000's of liters of pure contaminant - need to remediate to a few ppb or less?? 2. mobility. How fast will this move? 3. degradation rate at which organic material will degrade is dependent on the medium through which it travels. i.e. Small amounts of organic carbon is enough to slow this down.
Use of Extraction Wells to Remove Contaminated Ground Waters Freeze and Cherry, Figure 10.27
Remediating systems B. Problems: Volume calculations: · 10,000 liters of contaminant dissolves to affect 6,000,000,000 liters of plume!! ·15,000 liters of contaminant dissolves to affect 40,000,000,000 liters of plume! (This takes less than a tanker to contaminate this much!) • How much pure product is there and how can we get to it? • This ends up causing a lot of problems especially since water wells are close. • How hard will it be to remove ie 5 billion liters of water? EXTREMELY hard! http://www.inletkeeper.org/new%20pipelines%20page/Kenai%20National%20Wildlife%20Refuge%20Oil%20Spill.jpg
Remediating systems D. Why won't it work? * No aquifer is perfectly homogenous -- Even the simplest aquifer is heterogeneous (i.e. grain size). * Conductivity varies by at least an order of magnitude ie about 1 log unit. • What does this do to the system? • Small lenses form whose conductivity is 1 or 2 orders of magnitude less than the rest of the system. The NAPL will congregate on the low permeability area. Therefore it doesn't fall neatly straight down, but will cascade down and form a complex distribution.
Remediating systems D. Why won't it work? * Water will not be seeing NAPL and therefore may take a long or infinite amount of time to pump out. More time is needed for higher heterogeneity ---> These stringers of low conductivities hold NAPL and don't allow solubility and movement of it ---> never attack the material in fine-grained, low conductivity sediments. * L NAPL is easier to extract by vapor extraction if not too much is dissolved in the plume. Permeable Reactive Barriers –Partial Solution
Reduction of TCE concentrations at Moffett Field: note increase in DCE concentration (breakdown product of TCE) TCE reduction ~ 3 grams/day
PRB installed beneath infiltration beds ; note reduction of nitrate and ammonia by more than 90%
Denitrification by “PRB” –Vertical Wall Denitrification by “PRB” –Output from drainage tile