Download
1 / 7
70 likes | 203 Vues
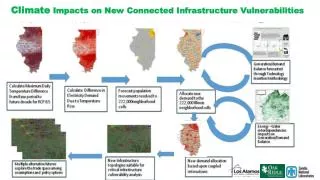
Climate Impacts on New Connected Infrastructure Vulnerabilities. RCP 8.5 Scenario de-constructs temperature increases to 1 km - then to increased power usage with latitude dependent temperature/usage relationships. cell.

E N D
Climate Impacts on New Connected Infrastructure Vulnerabilities
RCP 8.5 Scenario de-constructs temperature increases to 1 km - then to increased power usage with latitude dependent temperature/usage relationships cell
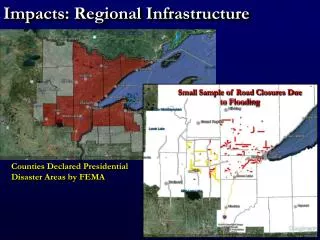
Forecast population movements through 2057 and convert moving customer changes to demand changes Based on Geographic customer increases associated in each cell, increased demand per customer, and changes in household size, a Demand Map is generated as an interim product Based on Landscan Dasymetric down scaling and modified gravity model of population migration, population and economic activity is forecasted
Coupled to demand changes from temperature and population movements, technology insertion scenarios modify the demand map
Demand and generation are further constrained by water availability applying insights from efforts such as the Energy-Water Nexus A suite of hydrology models can be stochastically tested for impact on Generation/Demand balance. Results of VIC model shown.
Post Technology and Water Availability Processing, a New Demand Map is Created At neighborhood scale, assumptions and the technology insertion create significant differences in the demand topology
Climate Impacts on New Connected Infrastructure Vulnerabilities • Preliminary Findings • The results demonstrated the feasibility of generating high resolution demand maps under different climate scenarios, the ability to couple power systems to changes in the water availability and hydrology changes, and the ability to perform what if analyses based on technology policies. Difference in Electricity Demand Per Cell Due to Temperature Rise and Population Shift, July 2057-July 2004