RPC gas purity
70 likes | 183 Vues
During the period from February 18 to February 26, 2013, anomalies were observed in the RPC gas flow rates, indicating noticeable changes in the performance of the EH#1 RPC system. A significant bump in the total and branch #1 flow rates was recorded, while four gases remained stable. The efficiency dropped by approximately 7%, suggesting a change in gas mixing ratios. Chromatograms showed small additional peaks related to potential impurities after R134A and isobutane changes. Ongoing monitoring of gas peak positions is recommended to detect further performance changes.

RPC gas purity
E N D
Presentation Transcript
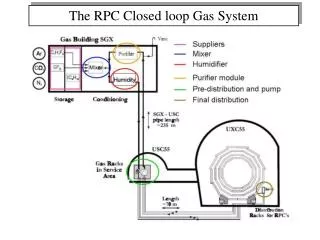
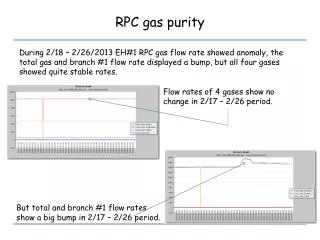
RPC gas purity During 2/18 – 2/26/2013 EH#1 RPC gas flow rate showed anomaly, the total gas and branch #1 flow rate displayed a bump, but all four gases showed quite stable rates. Flow rates of 4 gases show no change in 2/17 – 2/26 period. But total and branch #1 flow rates show a big bump in 2/17 – 2/26 period.
Performance of EH#1 RPC During that time period as reported by XuJilei the performance of EH#1 RPC system had quite noticeable change. The efficiency was ~7% lower! That is clear indication that gas mixing ratio was changed during that time.
Gas chromatograms We did find some small peaks stand out during that period. 2/23/2013 EH#1 2 additional peaks showed up
A possible explanation of the performance degradation As I learned from Jilei and Hansheng, EH#1 changed R134A at 8:35 am, 2/23, changed Isobutane at 22:00, 03/05. We trace down the seen extra small peaks and to see which gas cylinder is responsible to these extra peaks thru the following chromatograms: 2/21/2013 chromatogram showed no extra peaks, that means before R134A change, there was no extra impurity peak. 1/23/2013 chromatogram showed no extra peaks.
A possible explanation of the performance degradation (cont’d) Since 2/25 to now the small peaks remain in the chromatogram, however there is a tendency that the extra peaks are diminishing. This might be a clue that these peaks are produced by lighter impurity of R134A, which is boiling off faster than R134A. 3/20/2013 2/25/2013 chromatogram showed profound extra peaks. 3/28/2013 3/20 and 3/28 chromatogram showed smaller peaks.
Other two systems chromatograms At two other GC systems we also found additional peaks, but amplitude is much smaller: EH#2 3/27/2013 EH#2 2/23/2013 EH#3 3/27/2013 EH#3 2/23/2013
Gas peaks shifting I also notice that the gas peak’s positions (retaining time) are changing from time to time. We didn’t put the retaining time information into database before. It looks useful to have these retaining times in the database. I have modified the software, beginning from 3/27/2013 the peak retaining times are available. We can monitor the peaks to see if any performance change related to the peak position.