Exploring Statistics: Understanding Data Distributions
Learn how statistics helps gain insights about populations using samples. Generate and interpret data distributions, box plots, and more. Enhance skills in assessing variability and making inferences.

Exploring Statistics: Understanding Data Distributions
E N D
Presentation Transcript
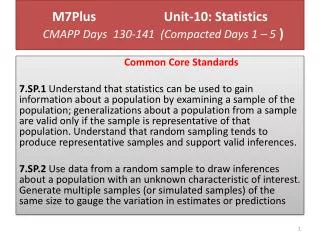
M7Plus Unit-10: StatisticsCMAPP Days 130-141 (Compacted Days 1 – 5 ) Common Core Standards 7.SP.1 Understand that statistics can be used to gain information about a population by examining a sample of the population; generalizations about a population from a sample are valid only if the sample is representative of that population. Understand that random sampling tends to produce representative samples and support valid inferences. 7.SP.2 Use data from a random sample to draw inferences about a population with an unknown characteristic of interest. Generate multiple samples (or simulated samples) of the same size to gauge the variation in estimates or predictions
M7Plus Unit-10: StatisticsCMAPP Days 130-141 (Compacted Days 1 – 5 ) Common Core Standards 7.SP.3 Informally assess the degree of visual overlap of two numerical data distributions with similar variabilities, measuring the difference between the centers by expressing it as a multiple of a measure of variability 7.SP.4 Use measures of center and measures of variability for numerical data from random samples to draw informal comparative inferences about two populations
M7Plus Unit-10: StatisticsCMAPP Days 130-141 (Compacted Days 1 – 5 ) Common Core Standards (from 6Plus – for 2012-13 only) Develop understanding of Statistical Variability. 6.SP.1 Recognize a statistical question as one that anticipates variability in the data related to the question and accounts for it in the answers. 6.SP.2 Understand that a set of data collected to answer a statistical question has a distribution which can be described by its center, spread, and overall shape. 6.SP.3 Recognize that a measure of center for a numerical data set summarizes all of its values with a single number, while a measure of variation describes how its values vary with a single number.
M7Plus Unit-10: StatisticsCMAPP Days 130-141 (Compacted Days 1 – 5 ) Common Core Standards (from 6Plus – for 2012-13 only) Summarize and describe distributions. 6.SP.4 Display numerical data in plots on a number line, including dot plots, histograms, and box plots. 6.SP.5 Summarize numerical data sets in relation to their context, such as by: • Reporting the number of observations. • Describing the nature of the attribute under investigation, including how it was measured and its units of measurement. • Giving quantitative measures of center (median and/or mean) and variability (interquartile range and/or mean absolute deviation), as well as describing any overall pattern and any striking deviations from the overall pattern with reference to the context in which the data were gathered. • Relating the choice of measures of center and variability to the shape of the data distribution and the context in which the data were gathered.
M7Plus Unit-10: Statistics4/15/13, Mon, Day 1 Data Distribution Learning Objective(s) Describe data distributions, dot/line plots, measures of center, bar graphs and histograms
M7Plus Unit-10: Statistics4/15/13, Mon, Day 1 Data Distribution Vocabulary-1
M7Plus Unit-10: Statistics4/15/13, Mon, Day 1 Data Distribution Vocabulary-2
M7Plus Unit-10: Statistics4/15/13, Mon, Day 1 Data Distribution CW/HW • WARM-UP: Find the mean, median, mode, and range of the following set of numbers: 42, 82, 88, 90, 90, 100, 106, 108, 110, 112
M7Plus Unit-10: Statistics4/15/13, Mon, Day 1 Data Distribution Exit-Ticket What would be a correct description of the data distribution in the dot plot (or line plot) below? A. The data distribution shows no gaps, two peaks, and the most popular colors are orange and brown. B. The data distribution shows three gaps, one peak, and the most popular color is red. C. The data distribution shows one gap, three peaks, and the most popular color is yellow. D. A description cannot be made about the data distribution.
M7Plus Unit-10: Statistics4/16/13, Tues, Day 2 Box Plots Learning Objective(s) Create and Interpret data from a boxplot display of the data distribution.
M7Plus Unit-10: Statistics4/16/13, Tues, Day 2 Box Plots CW/HW
M7Plus Unit-10: Statistics4/16/13, Tues, Day 2 Box Plots Exit Ticket A team scored the following number of points in its last eight games: 15, 24, 17, 19, 21, 38, 25, 39 Which number is the lower quartile for this data set? A. 31 B. 23 C. 18 D. 17
M7Plus Unit-10: Statistics4/17/13, Weds, Day 3 M.A.D Learning Objective(s) Find Mean Absolute Deviation and use it along with the mean to analyze a set of data and discuss its variability
M7Plus Unit-10: Statistics4/17/13, Weds, Day 3 M.A.D CW/HW D132 NOTES-MAD ; D132 PPT Mean Absolute Deviation;HWD132 Mean Absolute Deviation Supplement - http://www.youtube.com/watch?v=z9AJk7TvdpQ Exit Ticket
M7Plus Unit-10: Statistics4/18/13, Thurs, Day 4 Graph Interpretation – Part 1 Learning Objective(s) Interpret data from a variety of graphs
M7Plus Unit-10: Statistics4/18/13, Thurs, Day 4 Graph Interpretation – Part 1 CW/HW D133-134 Investigation 1 Teacher Directions D133-134 INVESTIGATION 1 Response SheetHandout Exit Ticket
M7Plus Unit-10: Statistics4/18/13, Thurs, Day 4 Graph Interpretation – Part 2 Learning Objective(s) Interpret data /graphs using the mean as the measure of center CW/HW Use D135-136 INVESTIGATION 3 Teacher Directions and D135-136 INVESTIGATION 3 Response Sheetto continue with the investigations in CMP2, RED, "Data About Us". Exit Ticket Find the measures of center (median and mean) for the following set and then tell which one is the best descriptor of "typical". Explain your choice. 20, 60, 66, 70, 72, 78, 82
M7Plus Unit-10: Statistics4/18/13, Thurs, Day 4 Graph Interpretation – Part 3 Learning Objective(s) Interpret and read data from a variety of graphs and use them to make predictions CW/HW Use D137-139 INVESTIGATIONS Teacher Directions and D137-139 INVESTIGATIONS Response Sheetalong with the teacher editions of CMP2, BLUE, "Data Distributions" and CMP2, BLUE, "Common Core Additional Investigations". Exit Ticket
M7Plus Unit-10: Statistics4/19/13, Fri, Day 5 Review & Assessment Learning Objective(s) Review and Show mastery of concepts and skills in problem-solving for categorical and numerical data graphs and interpretation